Overview :
Developed by Welles Wilder, the Swing Index seeks to isolate the “real” price of a security by comparing the relationships between the current prices (i.e., open, high, low, and close) and the previous period’s prices.
Interpretation :
The Swing Index is primarily used as a component of the Accumulation Swing Index.
Example :
The following chart shows the British Pound and the Swing Index.
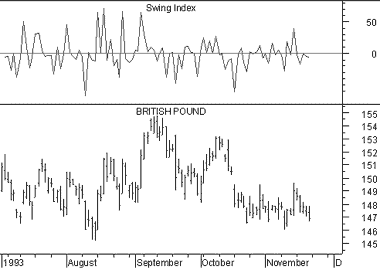
You can see that by itself, the Swing Index is an erratic plot. The value of this indicator develops when it is accumulated into the Accumulation Swing Index.
Calculation :
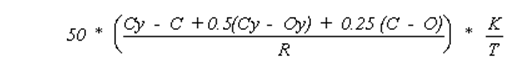
Although it is beyond the scope of this book to completely define the Swing Index, the basic formula is shown below. Step-by-step instructions on calculating the Swing Index are provided in Wilder’s book, New Concepts In Technical Trading Systems.
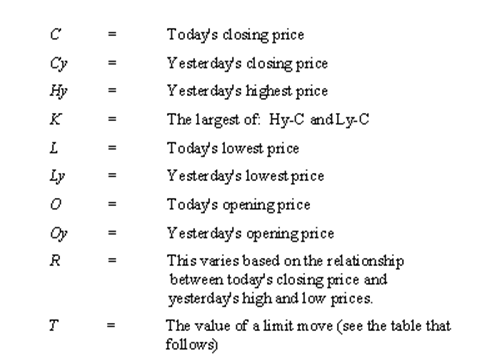
Where :
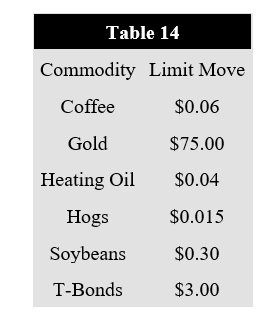
The following table lists the limit moves for several commodities. You can get a list of limit moves from your broker.