


Meta Platforms announced on Tuesday the launch of the largest version of their predominantly free AI models, Llama 3. This model features multilingual capabilities and general performance metrics that approach the level of paid models offered by competitors such as OpenAI.
Meta is offering the Llama models largely for free to developers, a strategy that Zuckerberg believes will lead to new innovations, reduce reliance on potential competitors, and increase engagement on the company’s main social networks. However, some investors have expressed concern about the costs associated with this move.
META (Weekly Chart)
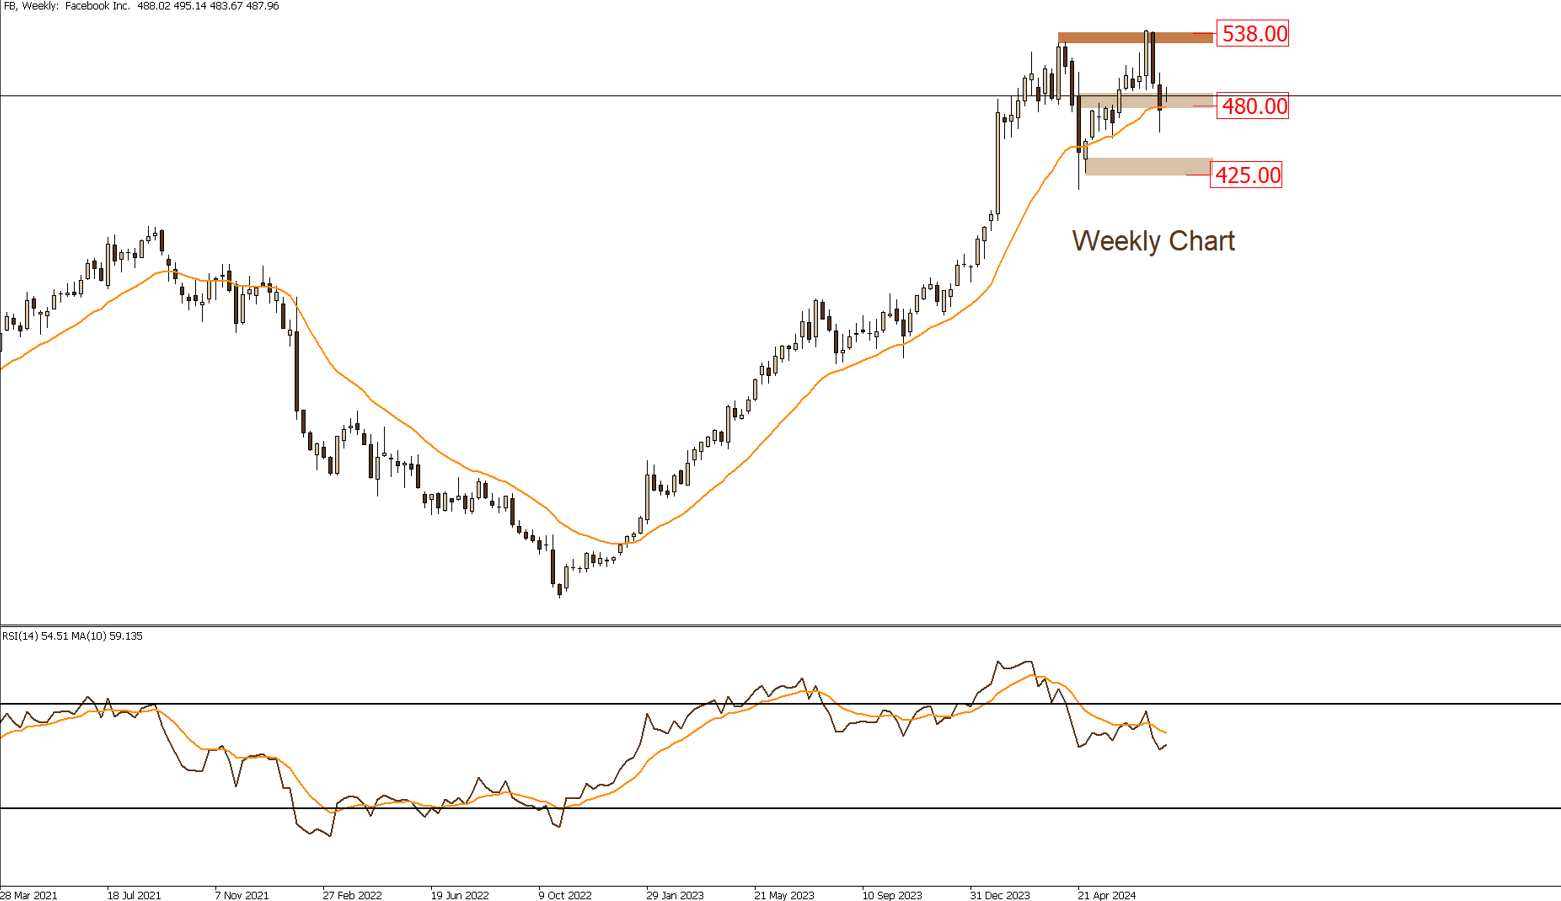
Meta’s stock is trading in an upward trend over the medium term, around the support area of $480. If it closes above this area on a weekly basis, we may target the resistance area of $538 in the following weeks. This scenario becomes invalid if the aforementioned support area is broken to the downside.
|
Support |
480 | 460 | 425 |
| Resistance | 510 | 528 |
538 |
META (1 Hour Chart)
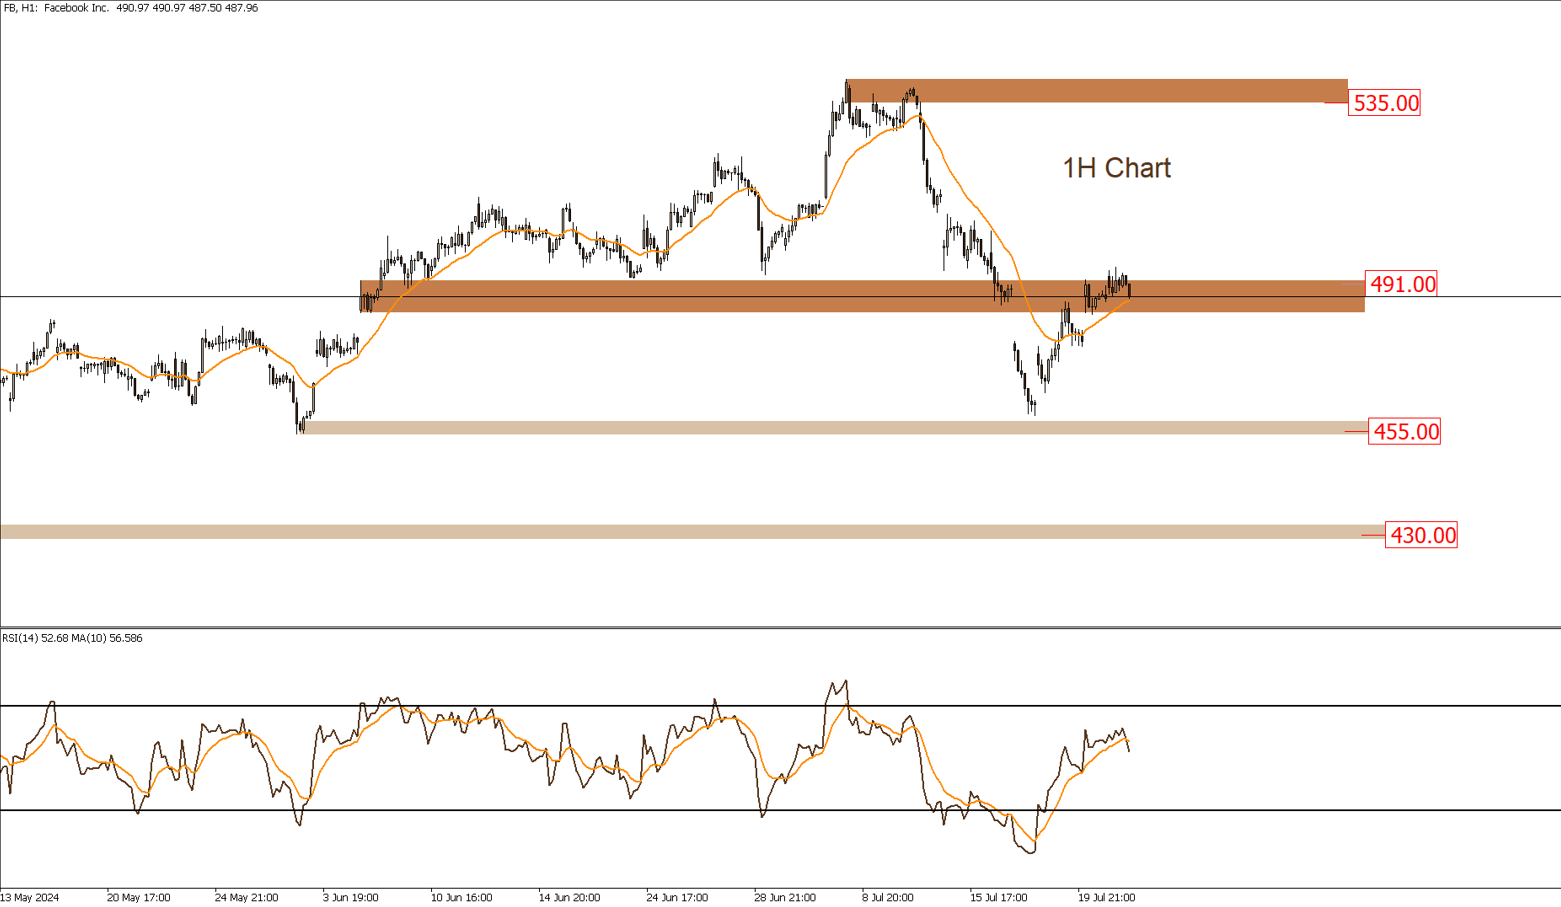
Meta stock is trading in a downward trend in the short term, around the resistance area of $491. If it breaks below the secondary support area around $482, we may target the main support area around $455. This scenario is invalidated if the previously mentioned resistance area is breached to the upside.
|
Support |
484 | 475 | 465 |
| Resistance | 491 | 508 |
535 |


