Cannot fetch data from server.

Speed Resistance Lines

0 39

Overview :
Speed Resistance Lines (“SRL”), sometimes called 1/3-2/3 lines, are a series of trendlines that divide a price move into three equal sections. They are similar in construction and interpretation to Fibonacci Fan Lines.

Interpretation :
Speed Resistance Lines display three trendlines. The slope of each line defines a different rate at which pricing expectations are changing.

Prices should find support above the 2/3 line. When prices do fall below the 2/3 line, they should quickly drop to the 1/3 line where they should then again find support.

Example:
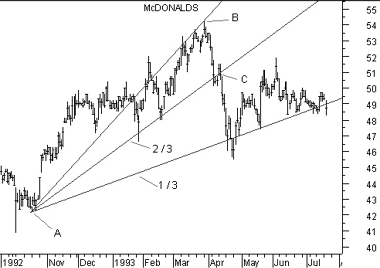
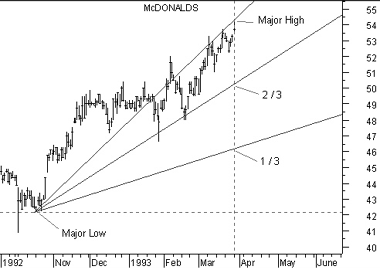
The following charts show McDonald’s price and Speed Resistance Lines.

The initial trendline was drawn from the low point labeled “A” to the high point labeled “B.” You can see that prices found support each time they fell to the 2/3 line. When prices finally penetrated the 2/3 line (at point “C”) they quickly fell to the 1/3 line where they again found support.

Calculation:
To draw Speed Resistance Lines:
1- Draw a line from a major low to a major high.
2- Draw a vertical line on the day the major high occurred. Divide this vertical line into thirds.
3- Draw lines from the major low so they intersect the vertical line at the 1/3 and 2/3 levels.

You can now benefit from LDN company’s services through the LDN Global Markets trading platform.

Leave A Reply

Your email address will not be published.