Cannot fetch data from server.

Quadrant Lines

0 55

Overview :
Quadrant Lines are a series of horizontal lines that divide the highest and lowest values (usually prices) into four equal sections.

Interpretation :
Quadrant Lines are primarily intended to aid in the visual inspection of price movements. They help you see the highest, lowest, and average price during a specified period.

Example :
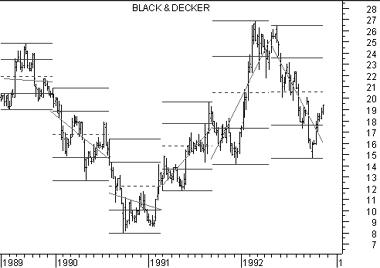
An interesting technique is to display a Linear Regression trendline and Quadrant Lines. This combination displays the highest, lowest, and average price, as well as the average slope of the prices. I used this technique on the following chart of Black & Decker.

Calculation :
Quadrant Lines are calculated by finding the highest-high and the lowest-low during the time period being analyzed. The top line is drawn at the highest price during the time period and the bottom line is drawn at the lowest price during the time period. The remaining three lines are then drawn so they divide the section between the highest-high and the lowest-low into four equal sections. The center line (the “mean”) is usually displayed as a dotted line.

You can now benefit from LDN company’s services through the LDN Global Markets trading platform.

Leave A Reply

Your email address will not be published.