Overview : The Money Flow Index (“MFI”) is a momentum indicator that measures the strength of money flowing in and out of a security. It is related to the Relative Strength Index, but where the RSI only incorporates prices, the Money Flow Index accounts for volume.
Interpretation:
The interpretation of the Money Flow Index is as follows:
1- Look for divergence between the indicator and the price action. If the price trends higher and the MFI trends lower (or vice versa), a reversal may be imminent.
2- Look for market tops to occur when the MFI is above 80. Look for market bottoms to occur when the MFI is below 20.
Example : The following chart shows Intel and its 14-day Money Flow Index.
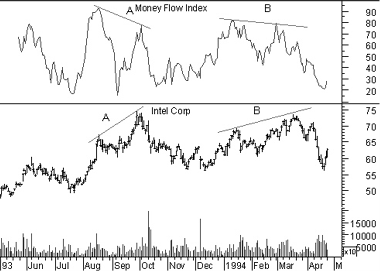
Divergences at points “A” and “B” provided leading indications of the reversals that followed.
Calculation :
The Money Flow Index requires a series of calculations. First, the period’s Typical Price is calculated.
![]() Next, Money Flow (not the Money Flow Index) is calculated by multiplying the period’s Typical Price by the volume.
Next, Money Flow (not the Money Flow Index) is calculated by multiplying the period’s Typical Price by the volume.
 Next, Money Flow (not the Money Flow Index) is calculated by multiplying the period’s Typical Price by the volume.
If today’s Typical Price is greater than yesterday’s Typical Price, it is considered Positive Money Flow. If today’s price is less, it is considered Negative Money Flow. Positive Money Flow is the sum of the Positive Money over the specified number of periods. Negative Money Flow is the sum of the Negative Money over the specified number of periods.
The Money Ratio is then calculated by dividing the Positive Money Flow by the Negative Money Flow.