Center Line : MA(CL, Period, Type)
Hi Band : Center Line + MA(True Range, Period, Type) * HiMultiplier
Lo Band : Center Line – MA(True Range, Period, Type) * LoMultiplier
True Range
TR = MAX{
1- ABS(HI1 – LO)
2- ABS(HI – CL1)
3- ABS(CL1 – LO)
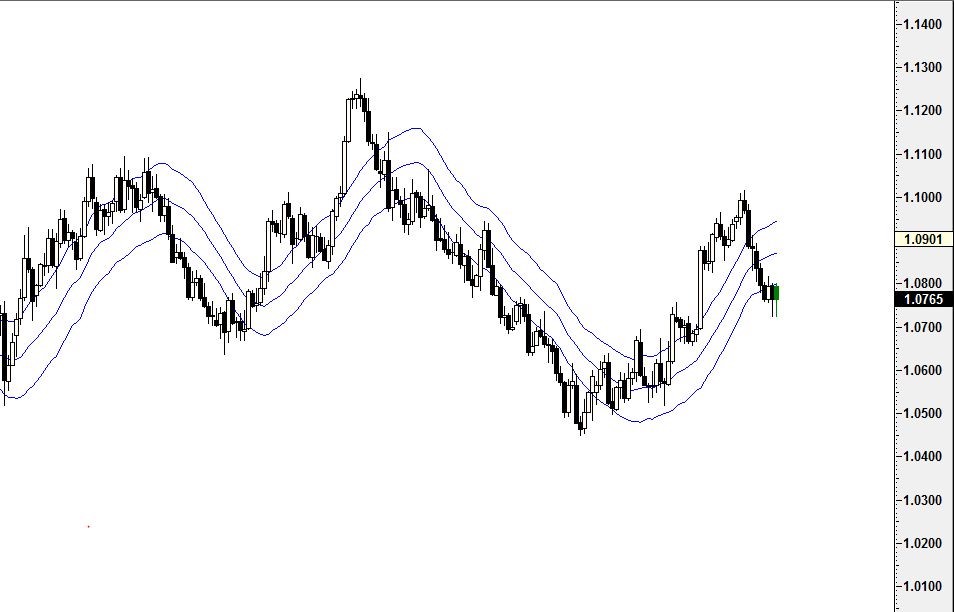
Above is a Daily Line Chart of an S&P 500 Future contract (SP`M) . The white line is the center line of the Keltner study, while the Blue lines represent the high and low bands, based on the preferences specified below.
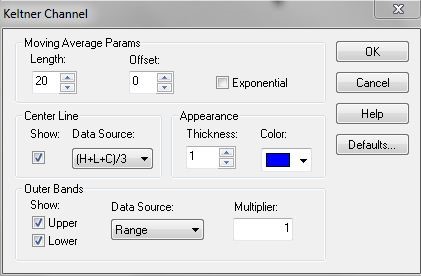
The Preferences . . .
1- MA Type – Moving Average type, which is applied to both the true range, and the closing price in the calculation.
2- MA Period – Moving Average period, which is applied to both the true range, and the closing price in the calculation.
3- Center Line Color – Color of the Center Line.
4- Hi Band Color – Color of the High Band.
5- Lo Band Color – Color of the Low Band.