


DOLLAR INDEX
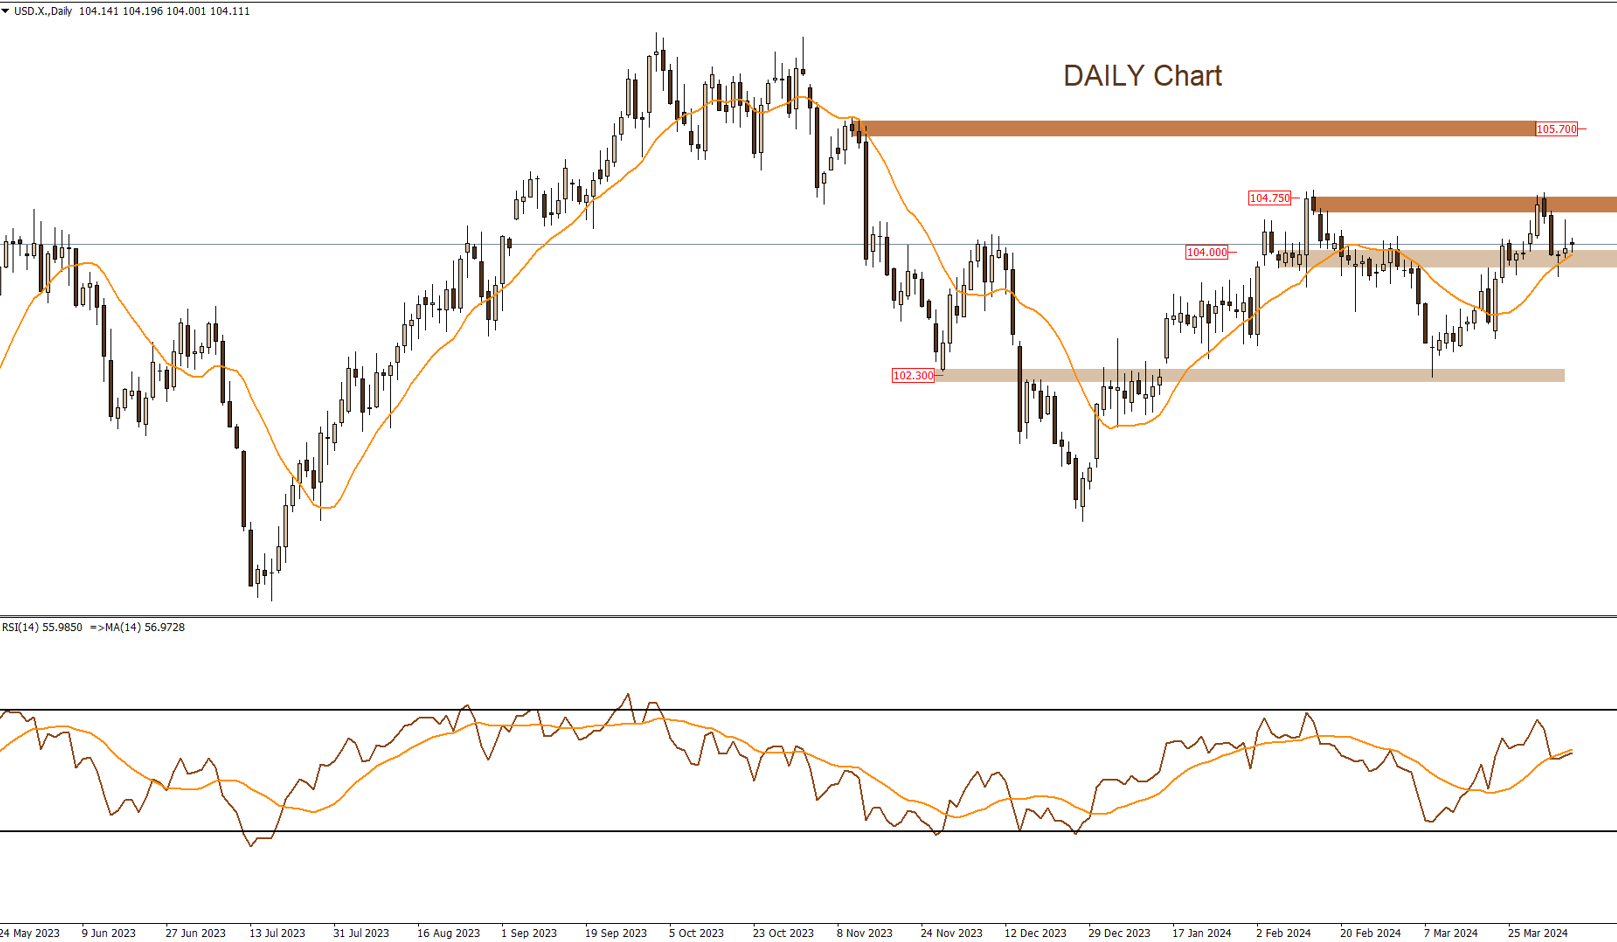
The index is trading near a support zone within the range of 104 to 103.75. It is anticipated that prices will rebound upwards and test the resistance zone at 104.75. However, this scenario would be invalidated if the support zone mentioned earlier is broken downwards.
|
Support |
104 | 103.75 | – | |||
| Resistance | 104.50 | 104.75 | – | |||
EURUSD
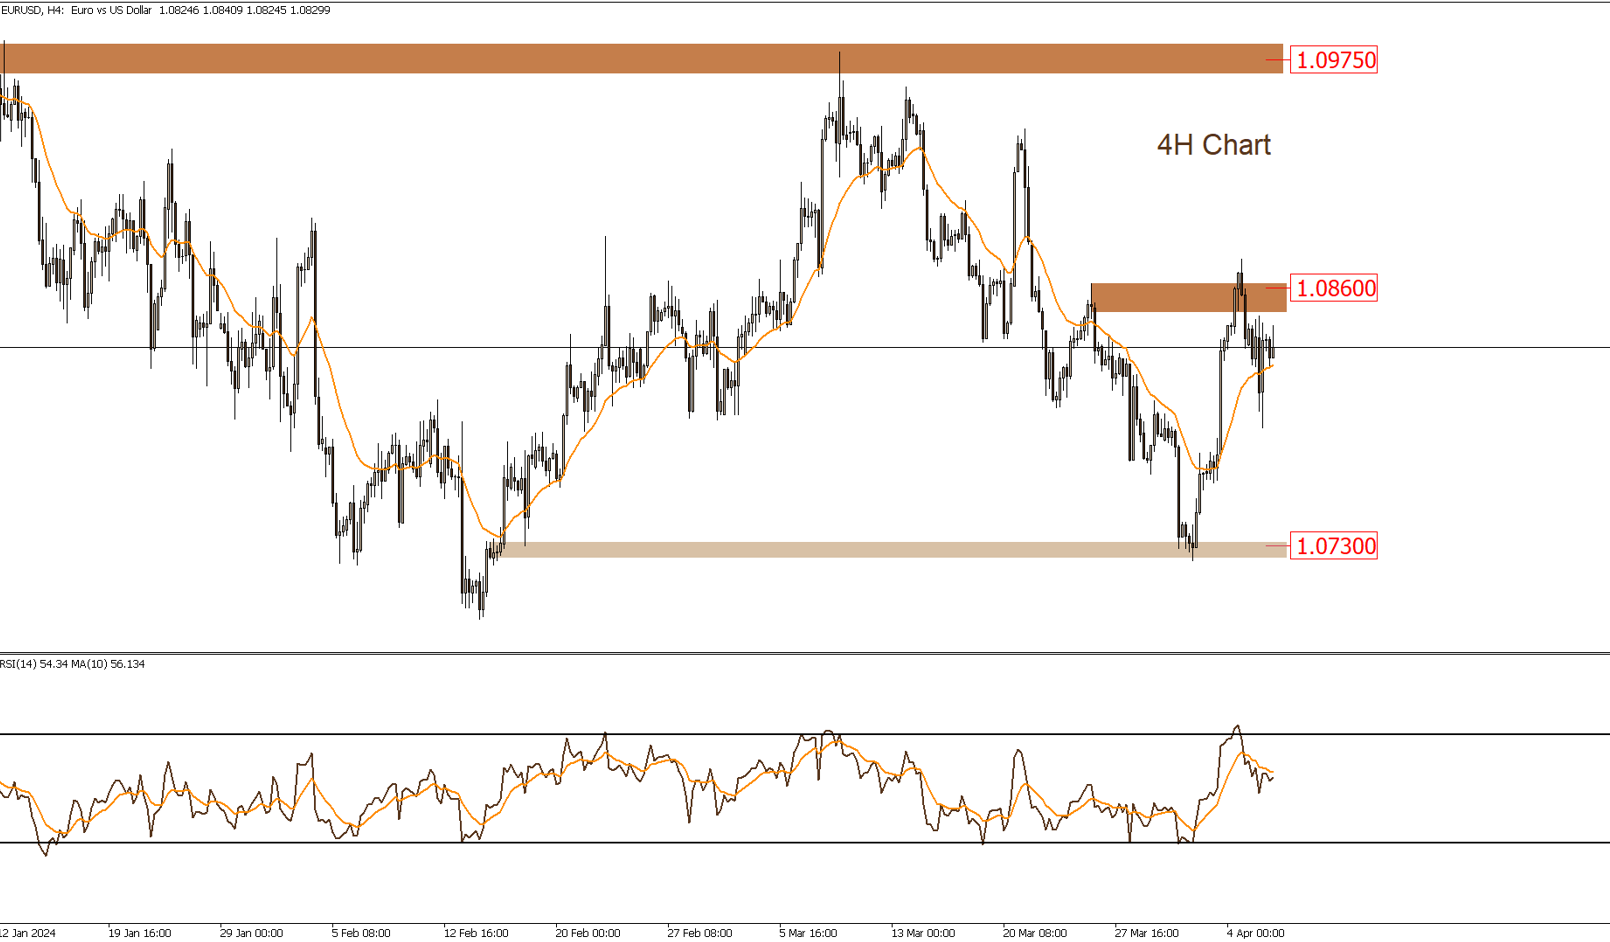
Prices are trading below the resistance area in the range of 1.0860, which if breached to the upside, we may target 1.0975. However, it is expected that the 1.0860 area could impede the upward momentum and lead to a retest of the support area at 1.0730.
|
Support |
1.0800 | 1.0770 | 1.0730 | |||
| Resistance | 1.0845 | 1.0860 |
1.0975 |
|||
GBPUSD
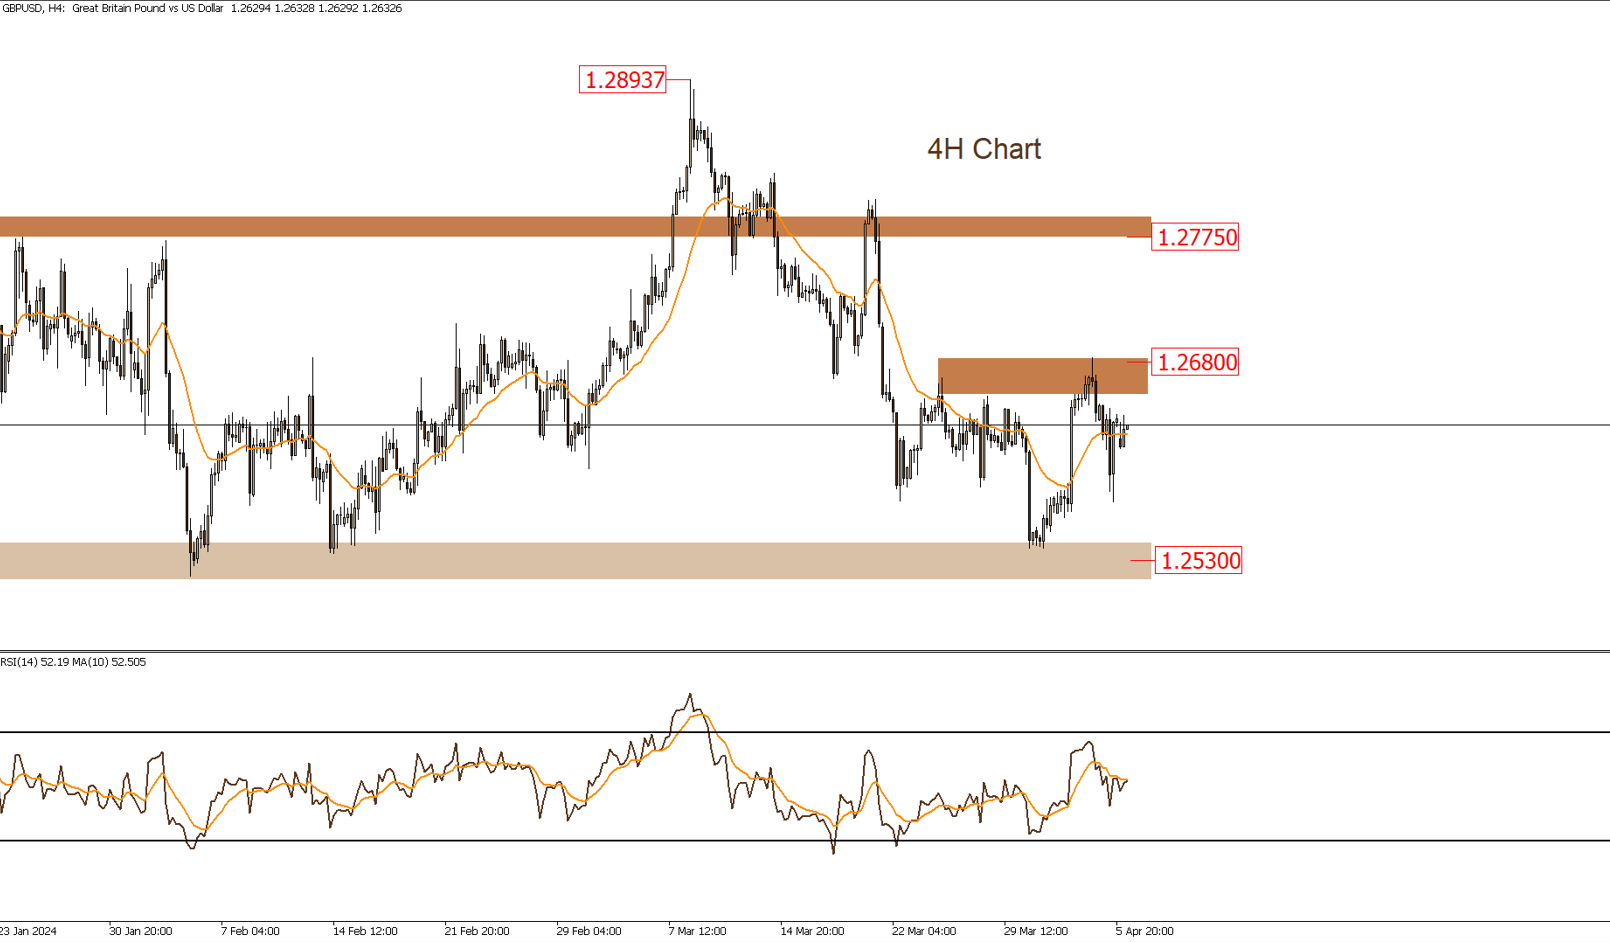
Prices are trading in a narrow sideways range in the short term, between the minor resistance area at 1.2680 and the support area at 1.2530. If the support area is breached to the downside, we may witness a sharp decline in prices. However, if the previously mentioned resistance area is breached to the upside, we may target 1.2775.
|
Support |
1.2600 | 1.2585 | 1.2550 | ||
| Resistance | 1.2680 | 1.2775 |
1.2800 |
||
USDJPY
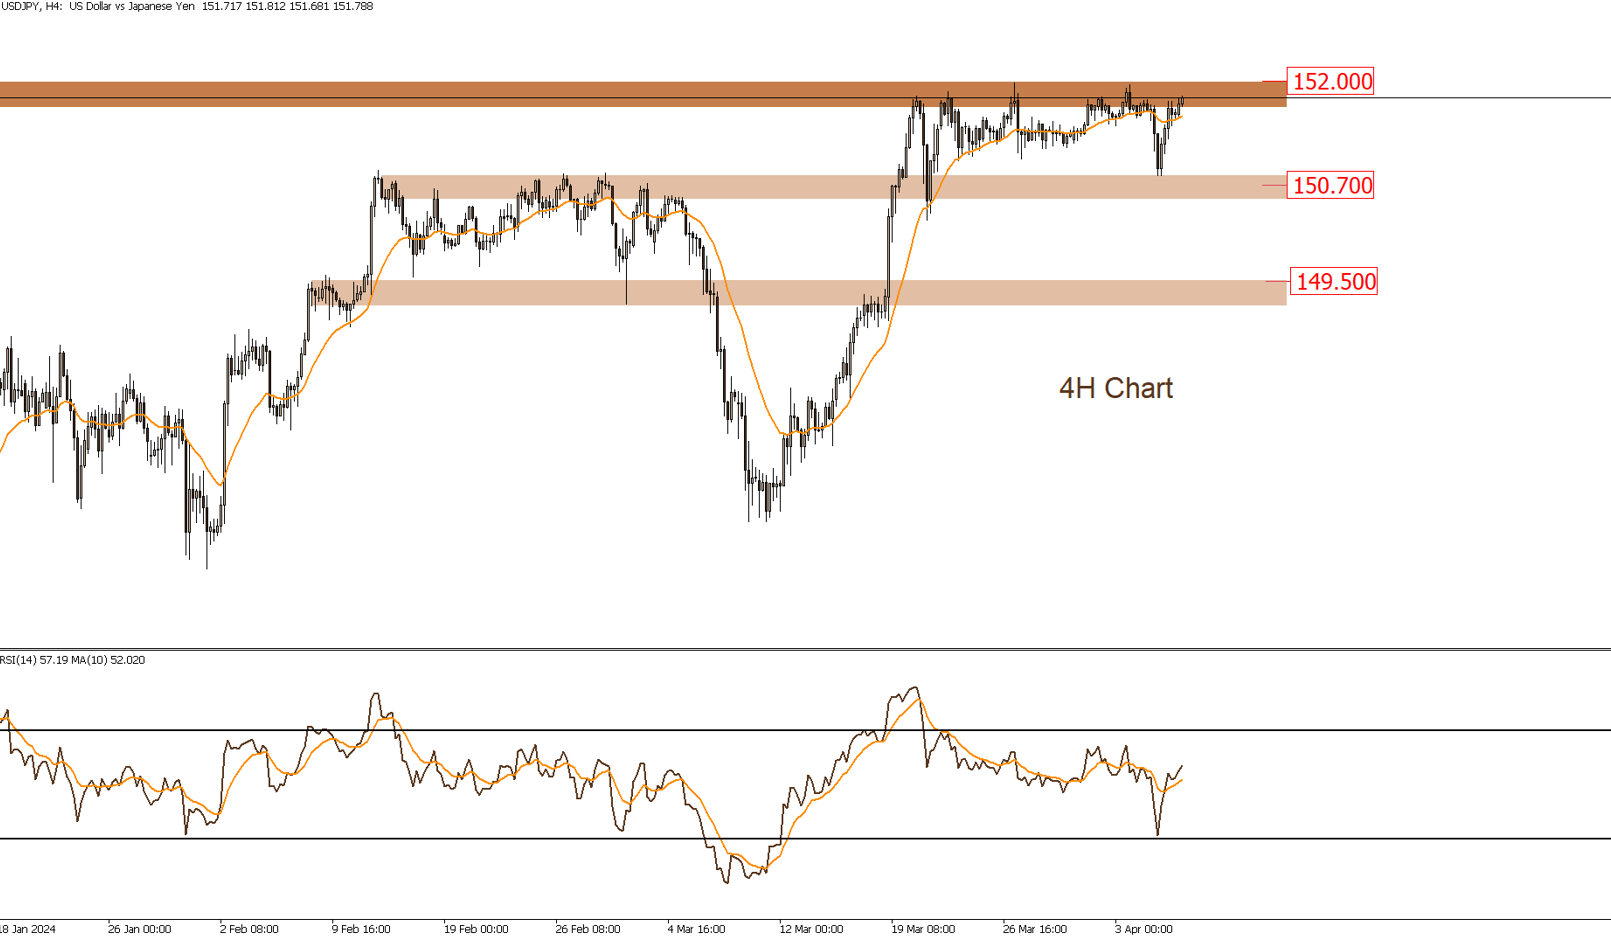
Prices are trading below a significant resistance level in the range of 152. It is expected that the USD/JPY pair will move sideways in the short term between the previously mentioned resistance areas and the support zone at 150.50. However, if prices break above the 152 level, we may witness a sharp rise in prices.
|
Support |
151.15 | 151 | 150.50 | |||
| Resistance | 152 | – | – | |||
GOLD
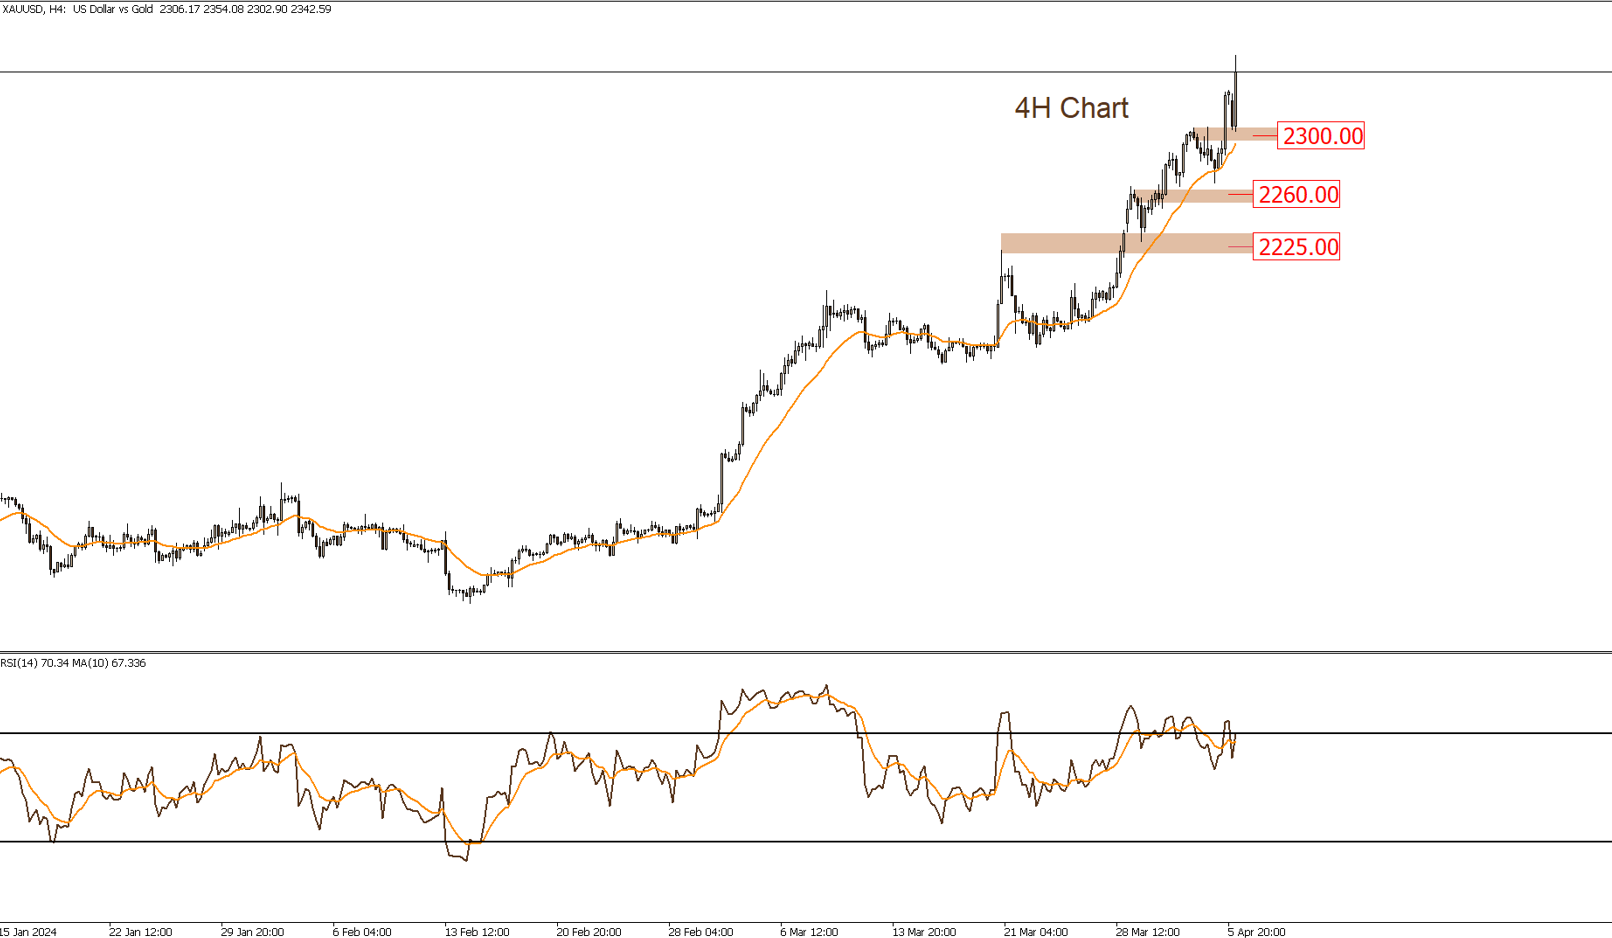
The gold market has recently reached new historical highs in previous trading sessions, confirming its medium-term upward trend. This suggests potential for prices to target new higher levels. However, in the event of a breakdown below the support zone at $2300, we may target $2260.
|
Support |
2330 | 2300 | 2260 | |||
| Resistance | 2350 | 2400 |
– |
|||
USOIL
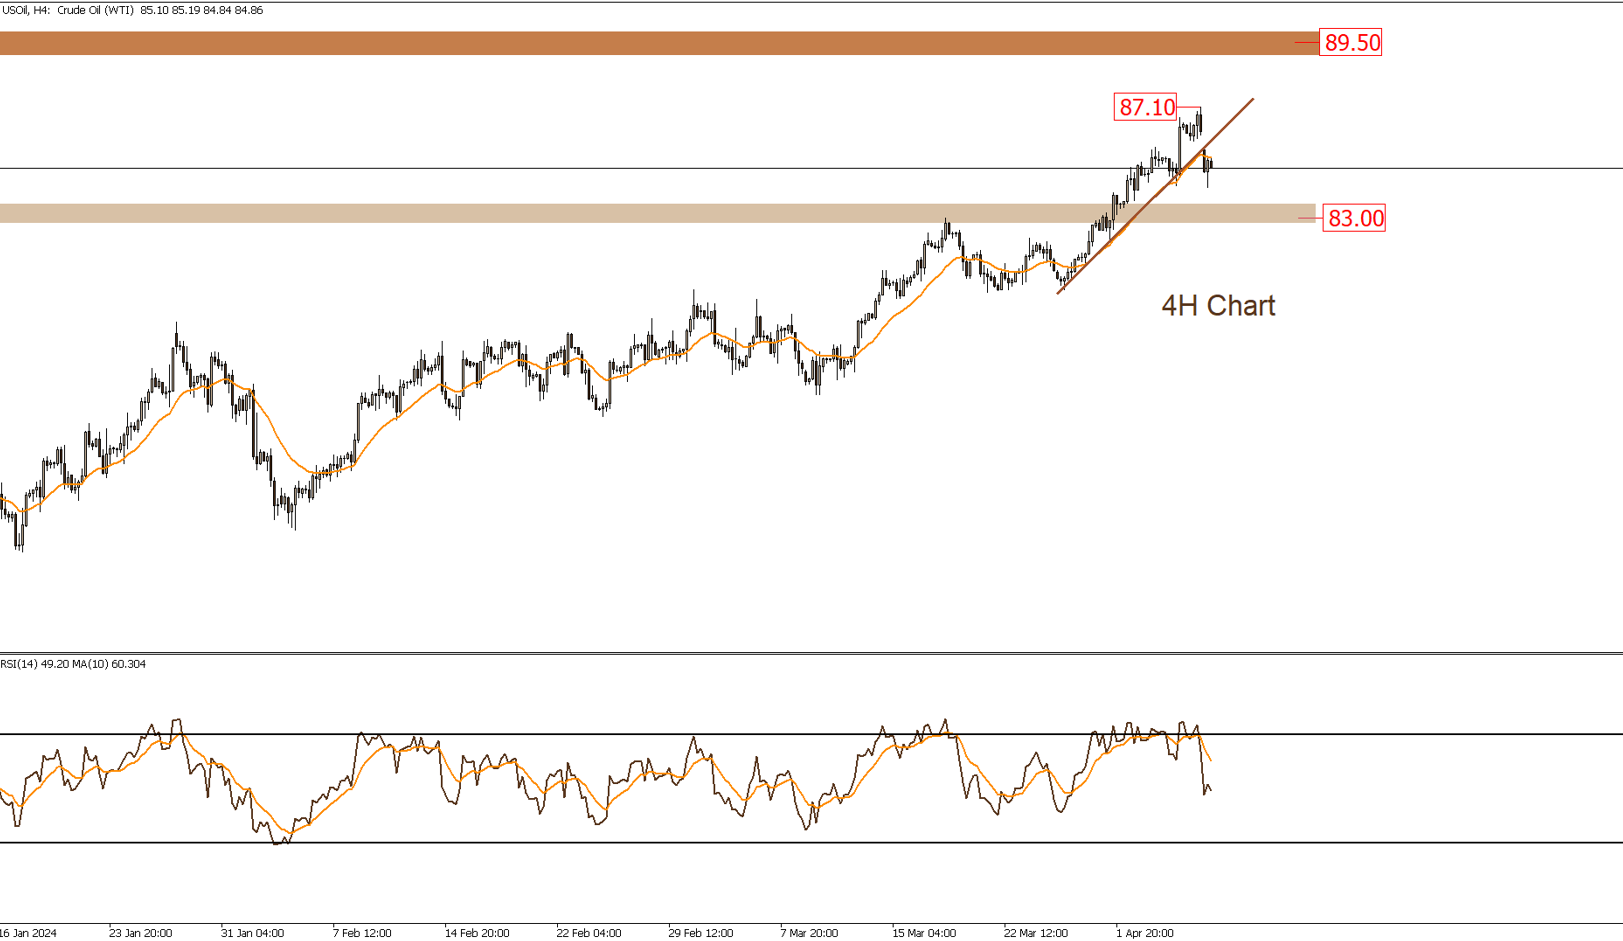
Oil prices continue to trend upwards in the short term. However, this outlook would change if the support zone at $84-$83 is breached downwards. In such a scenario, we may expect prices to trade sideways between the mentioned support levels and $87.
|
Support |
84.5 | 84 | 83.5 | |||
| Resistance | 85.3 | 87.1 |
89.5 |
|||
BTCUSD
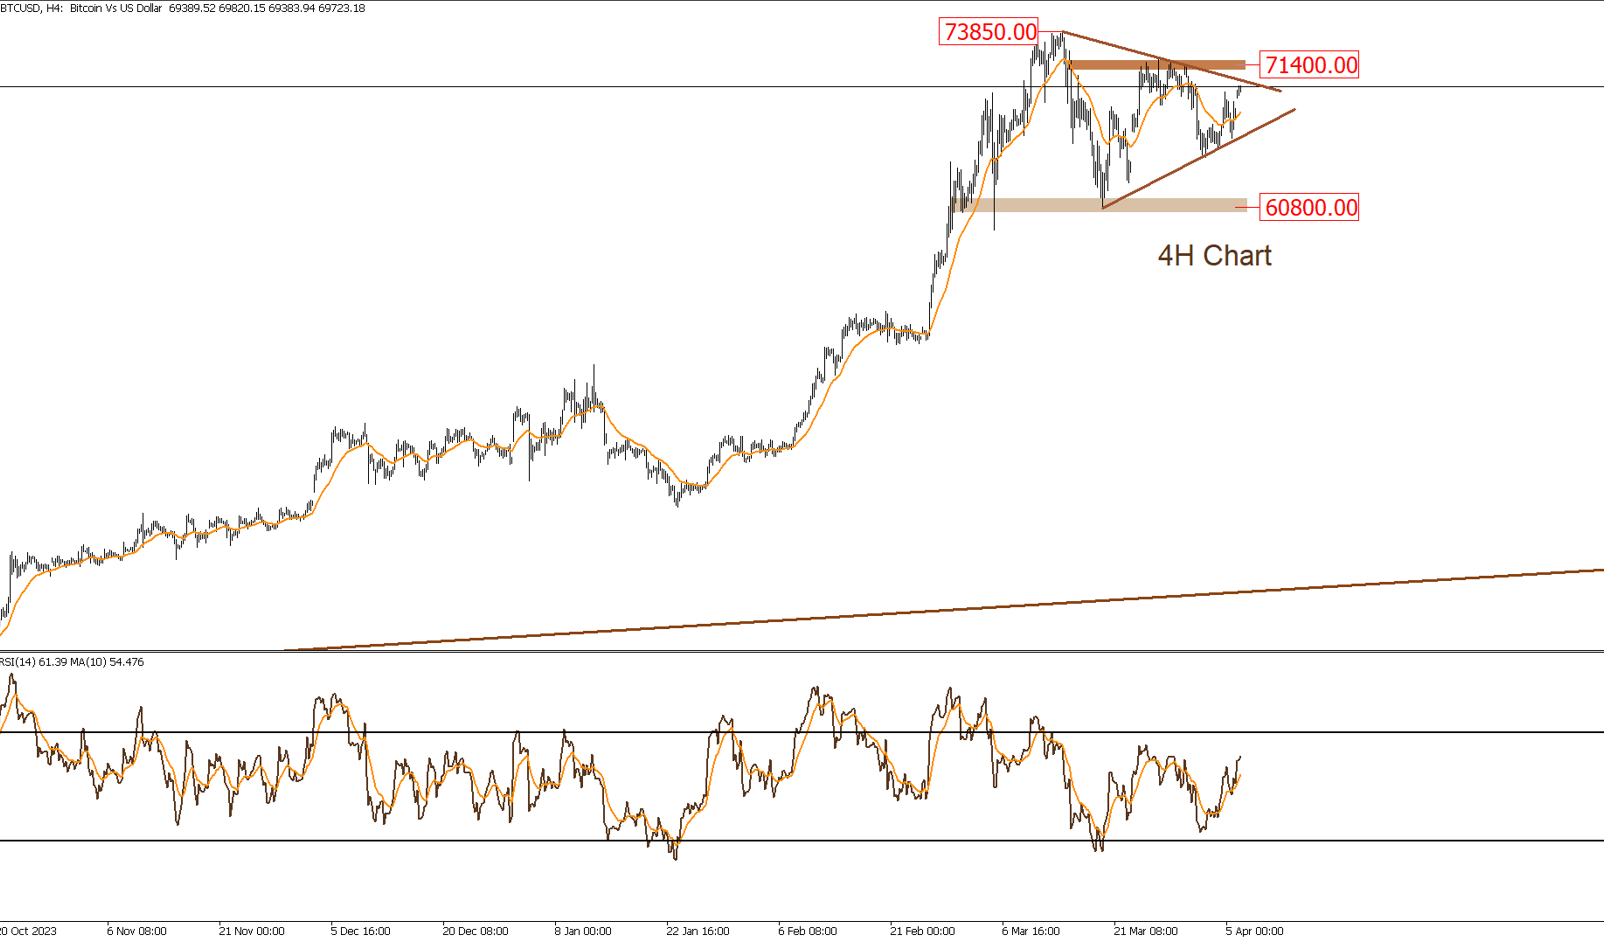
Prices are currently trading sideways in the short term. If there is a breakout above the descending trendline and a confirmed breach of the resistance level at $71,400, it is likely that Bitcoin will resume its upward trend in the medium term. However, if the upward trendline is broken below in the range of $66,000, we may test $60,800.
|
Support |
68400 | 65000 | 64300 | |||
| Resistance | 71400 | 73850 | – | |||
DOW JONES
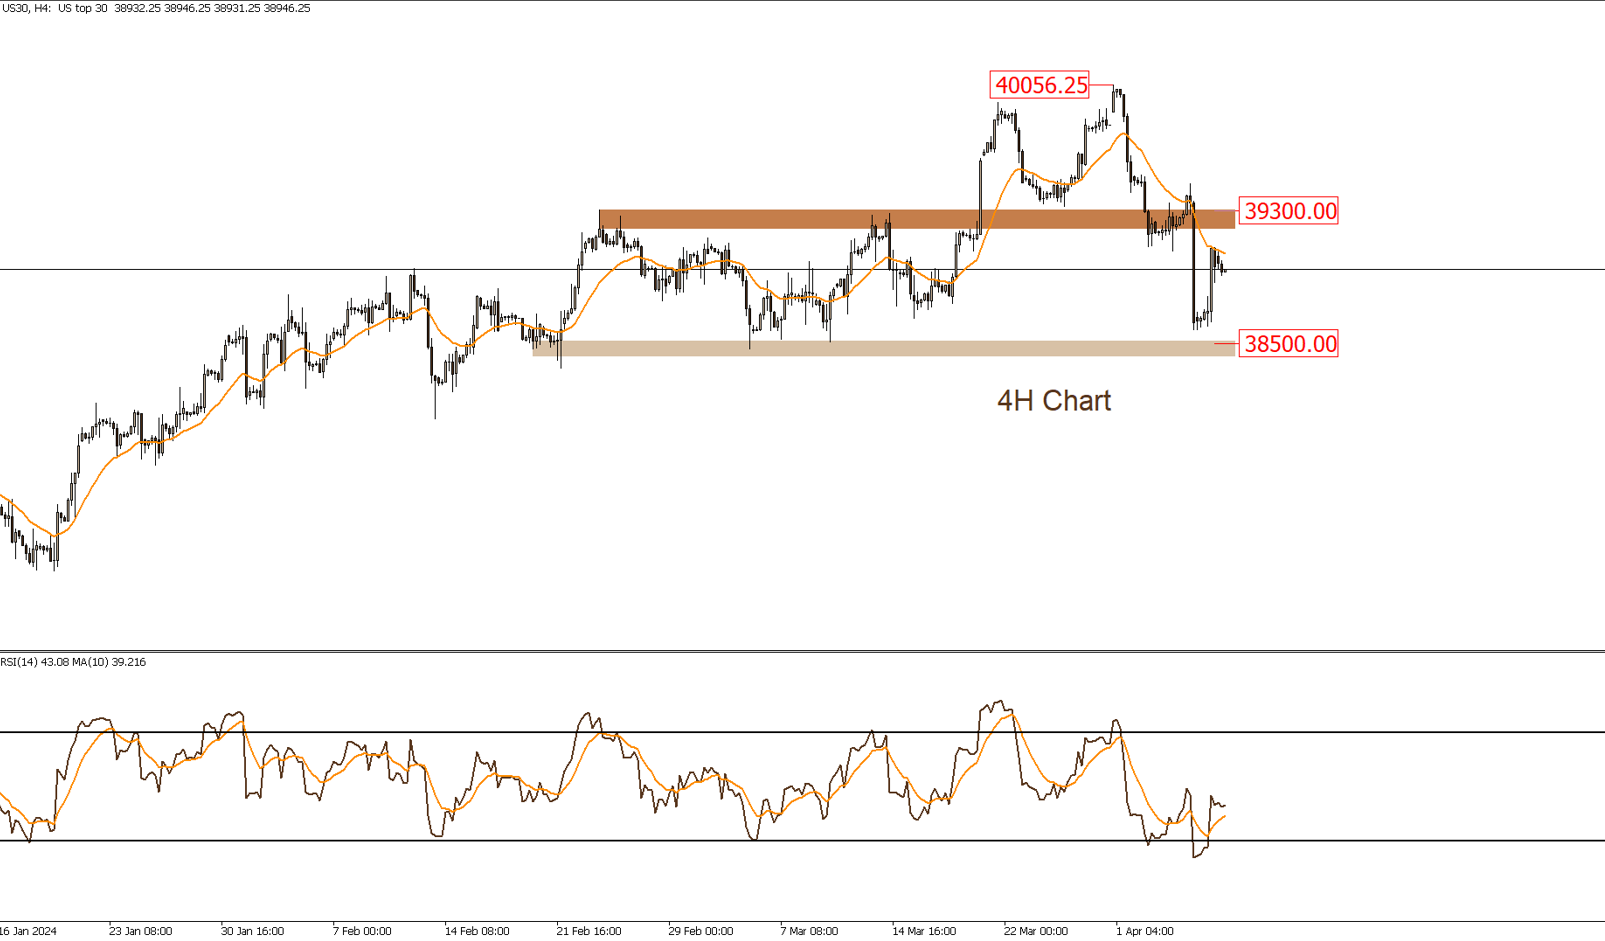
The Dow Jones index is trending upwards in the medium term However, recent sessions saw selling pressure near the $40,000 level, leading to a decline that breached $39,300 and tested the $38,500 area as anticipated. If this level is broken downwards, we may see a test of $38,000. Conversely, a re-break of prices above $39,300 could invalidate this scenario, signaling a potential.
|
Support |
38500 | 38300 | 38000 | |||
| Resistance | 39300 | 39500 |
40050 |
|||
NASDAQ
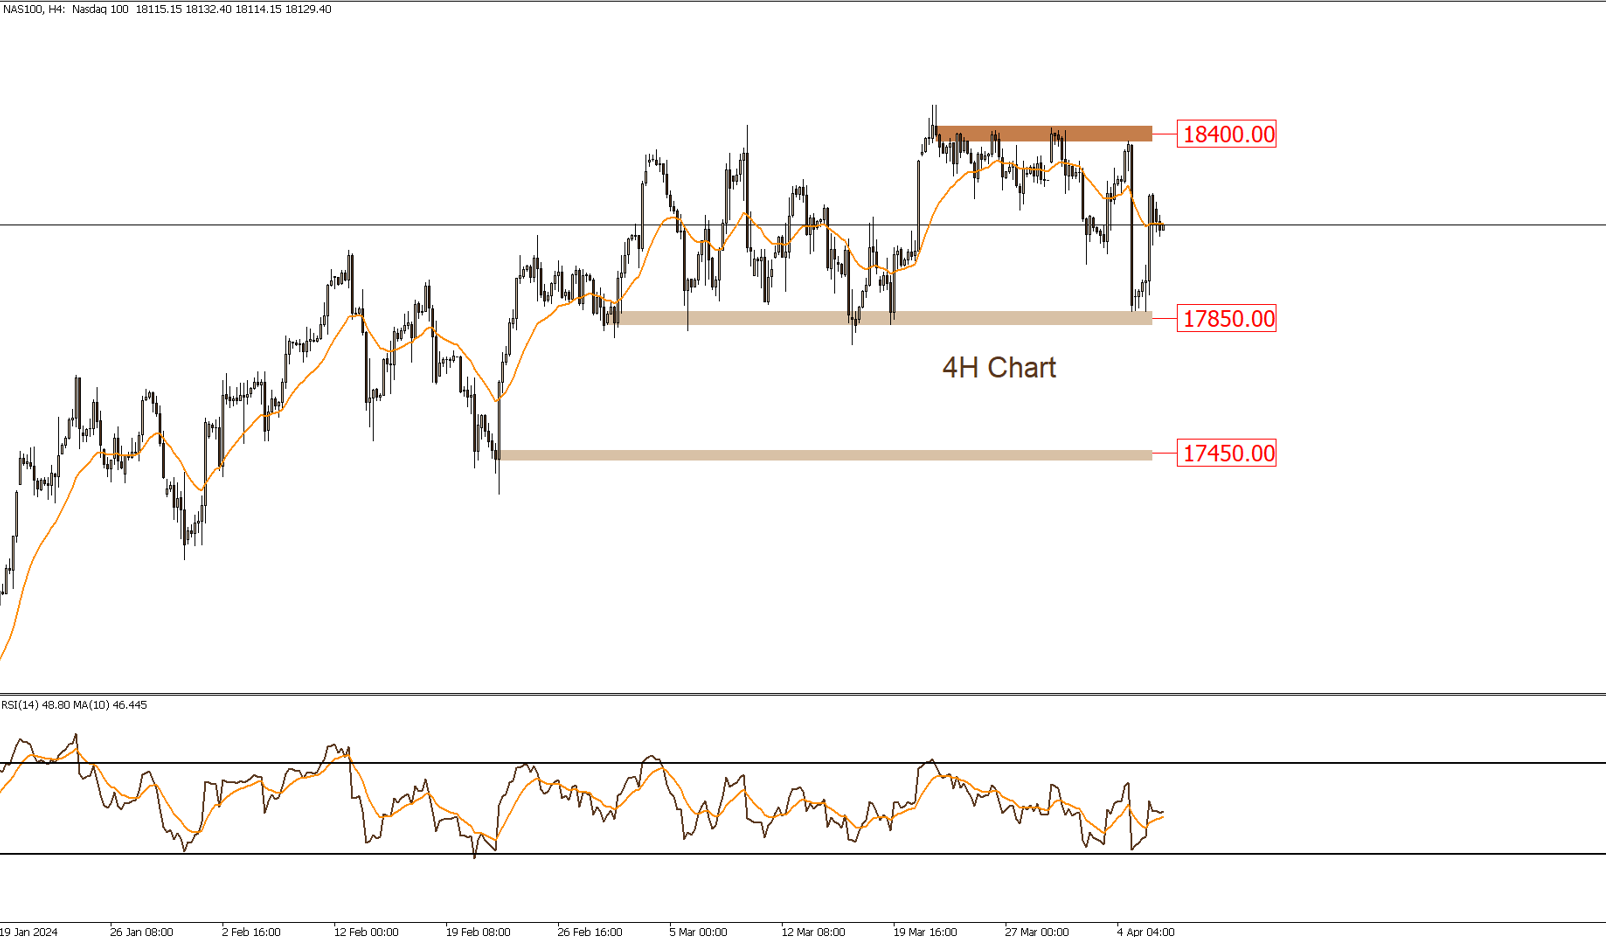
The Nasdaq index is trading sideways in the short term, between the resistance zone at $18,400 and the support zone at $17,850. In the event of a breakdown below the support zone, we may test $17,450. However, if prices break above this sideways range, the index may resume its upward trend in the short term.
|
Support |
17850 | 17450 | – | |||
| Resistance | 18300 | 18400 |
18490 |
|||


