


DOLLAR INDEX
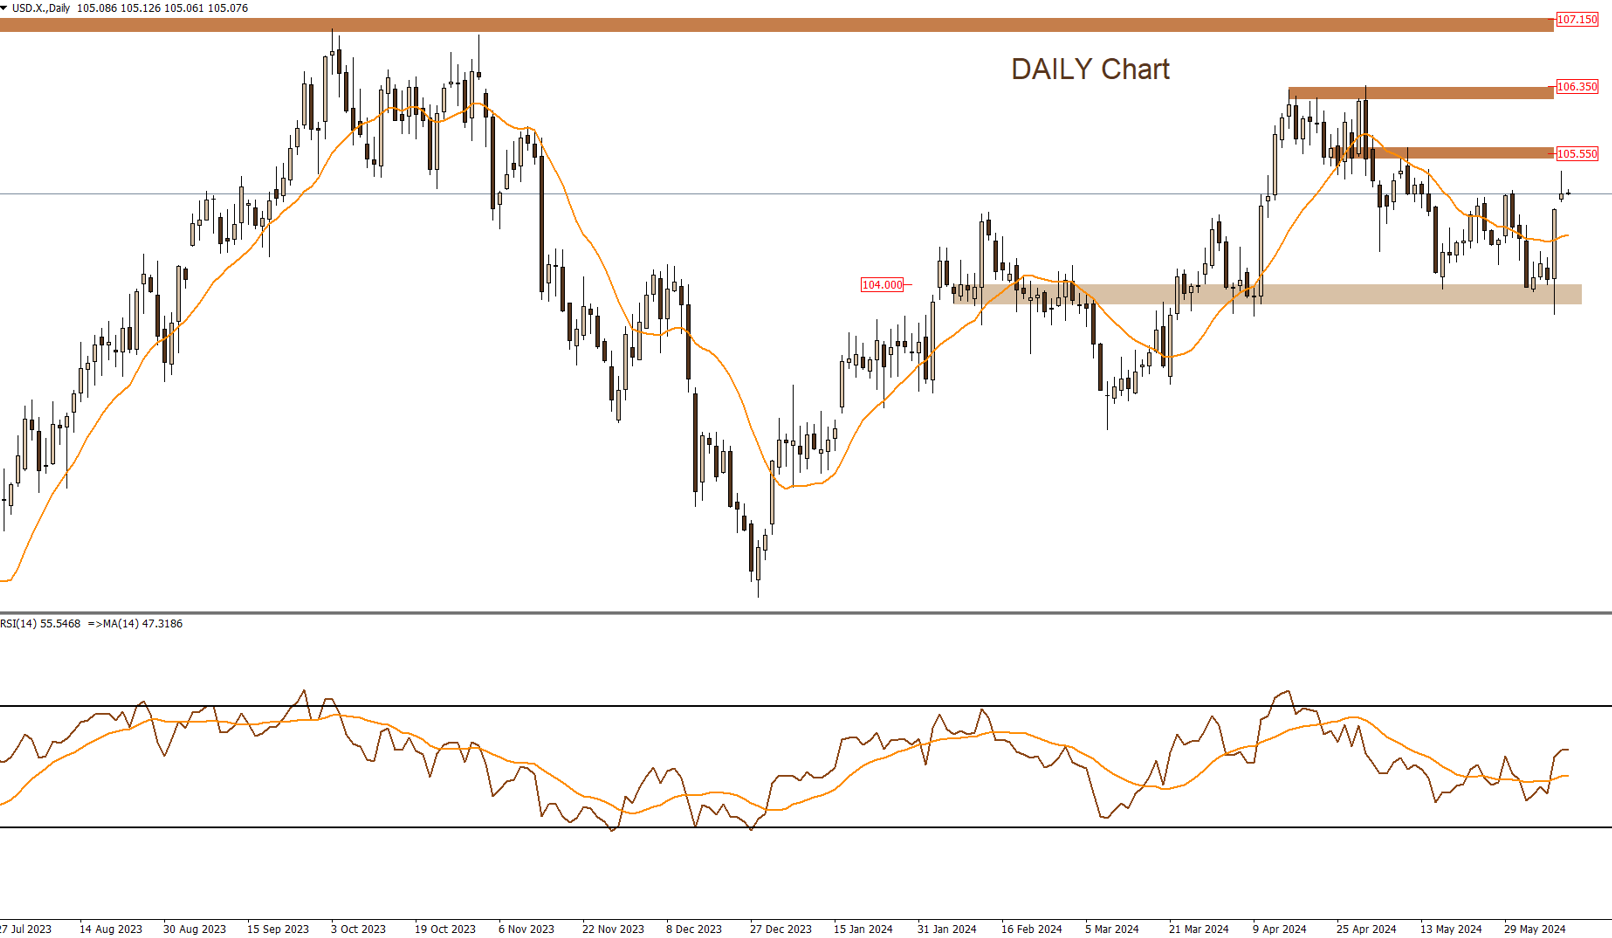
The US Dollar Index is moving within a wide sideways range between the support zone at 104 and the resistance zone at 105.55. If the resistance zone at 105.55 is broken to the upside, the target may be 106.35. It is expected that the index will retest the 105.55 zone again in the upcoming trading sessions.
|
Support |
104.50 | 104 | 103.60 |
| Resistance | 105.35 | 105.55 |
– |
EURUSD
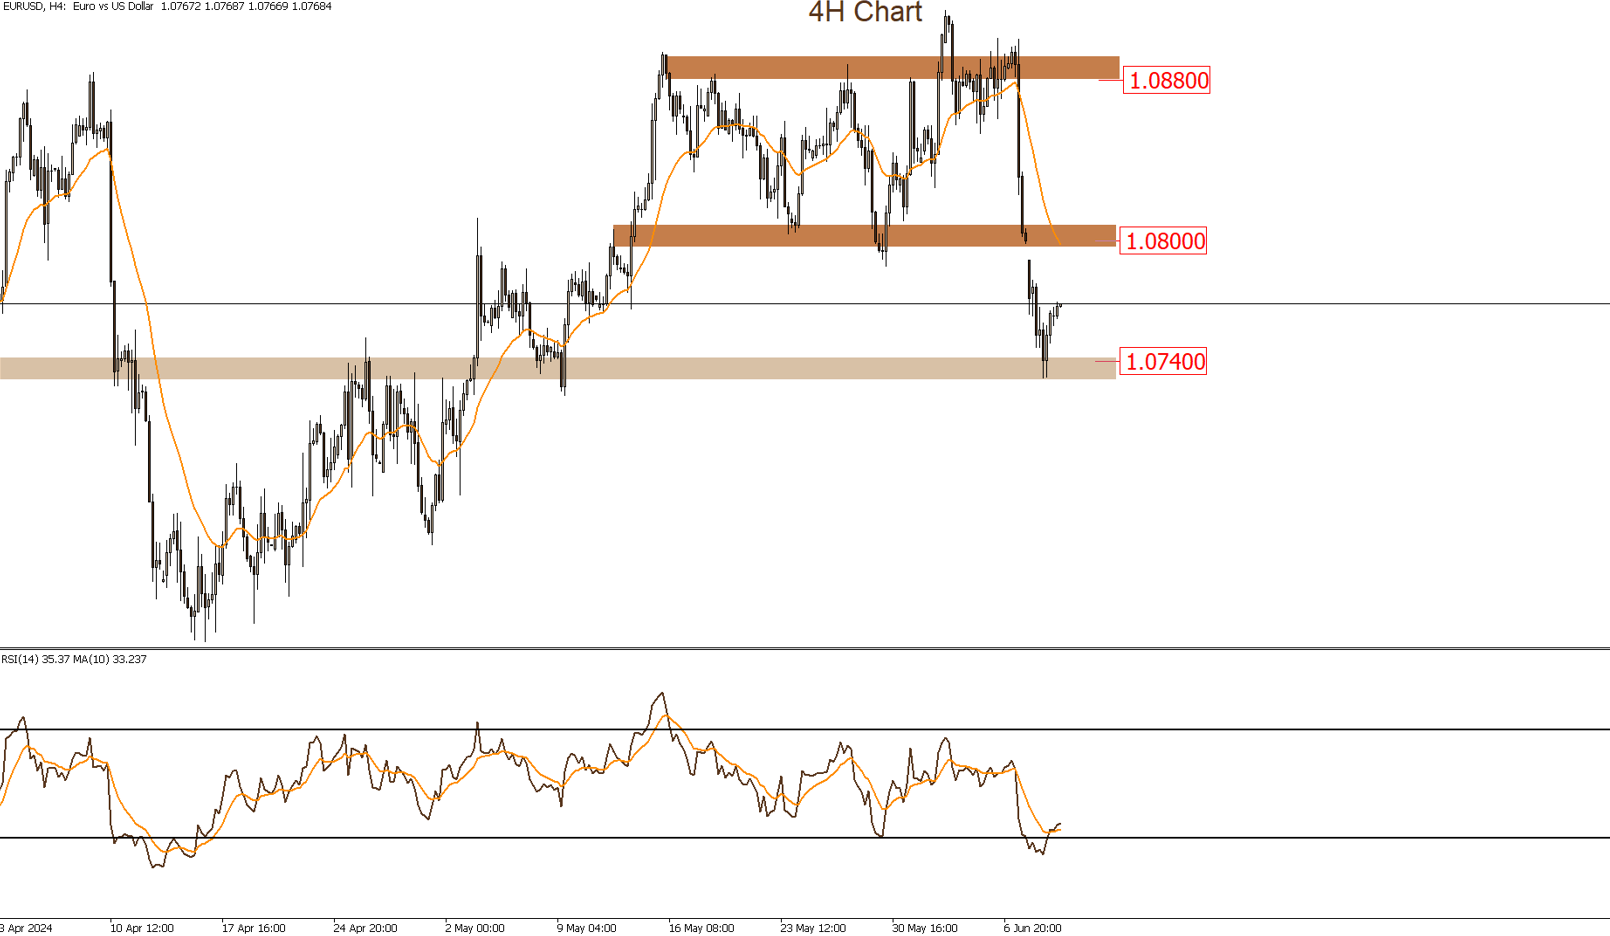
The EUR/USD pair dropped from the resistance zone around 1.0880 and tested the main support zone at 1.0740. If the support at 1.0740 is broken to the downside, the target may be 1.0650. It is likely that prices will move within a narrow sideways range between the secondary resistance zone at 1.0770 and the support zone at 1.0740 in today’s trading sessions.
|
Support |
1.0740 | 1.0720 | 1.0675 |
| Resistance | 1.0770 | 1.0800 |
1.0880 |
GBPUSD
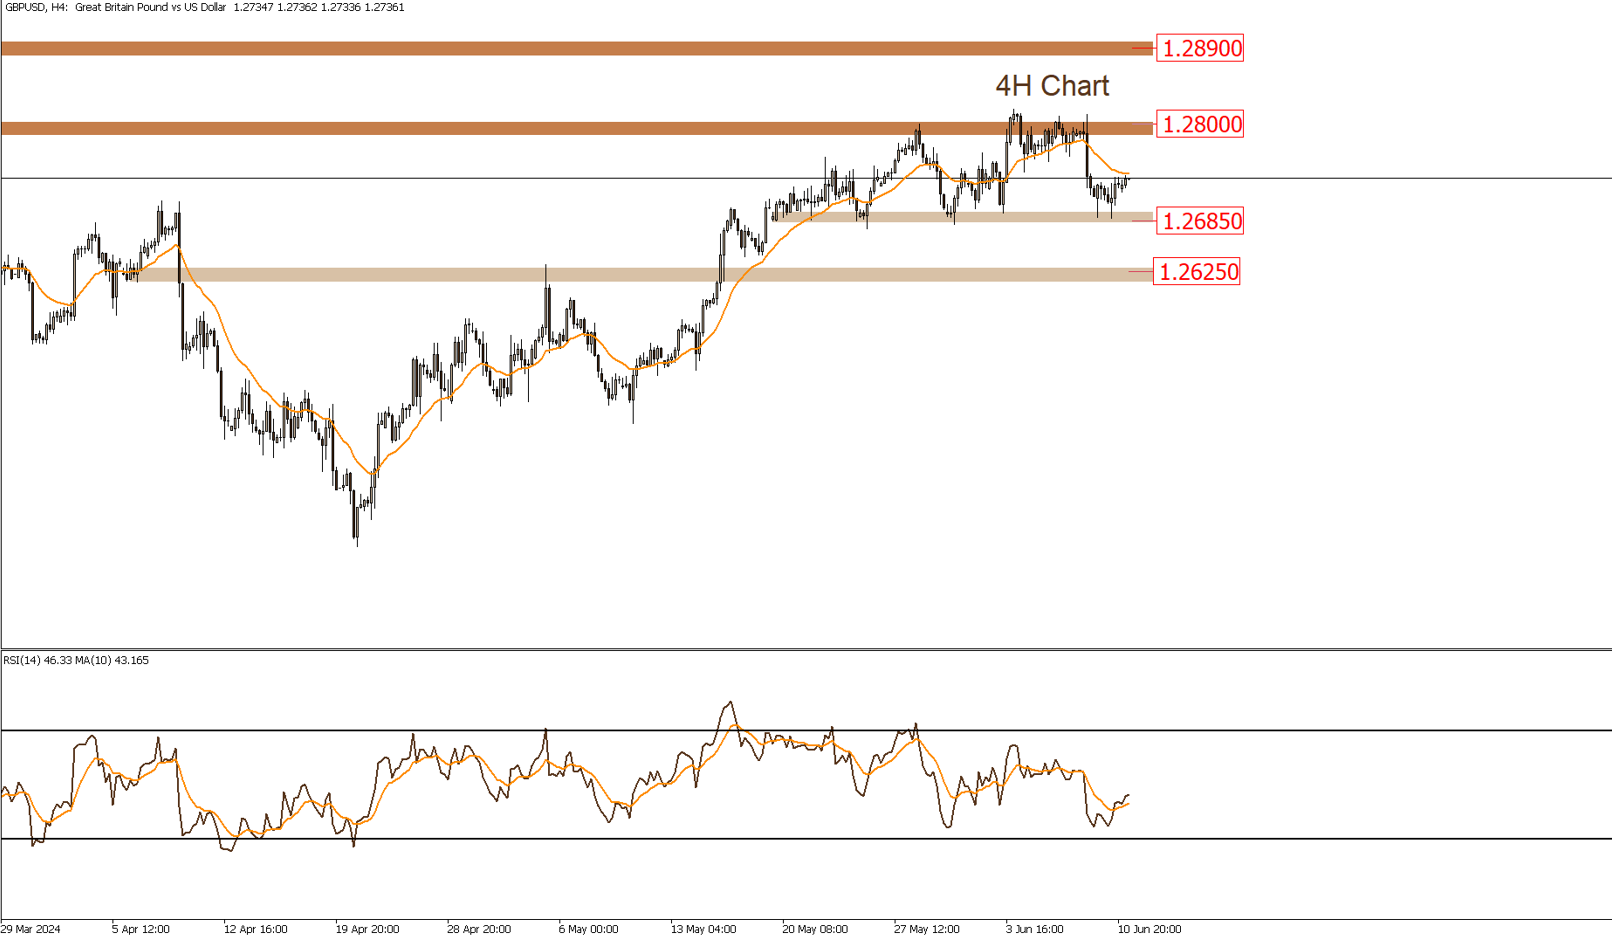
The GBP/USD pair rebounded from the support zone at 1.2685. If this support is broken to the downside, the next target may be 1.2625. It is likely that prices will face selling pressure today within the secondary resistance zone at 1.2760.
|
Support |
1.2700 | 1.2685 | 1.2625 |
| Resistance | 1.2760 | 1.2800 |
1.2825 |
USDJPY
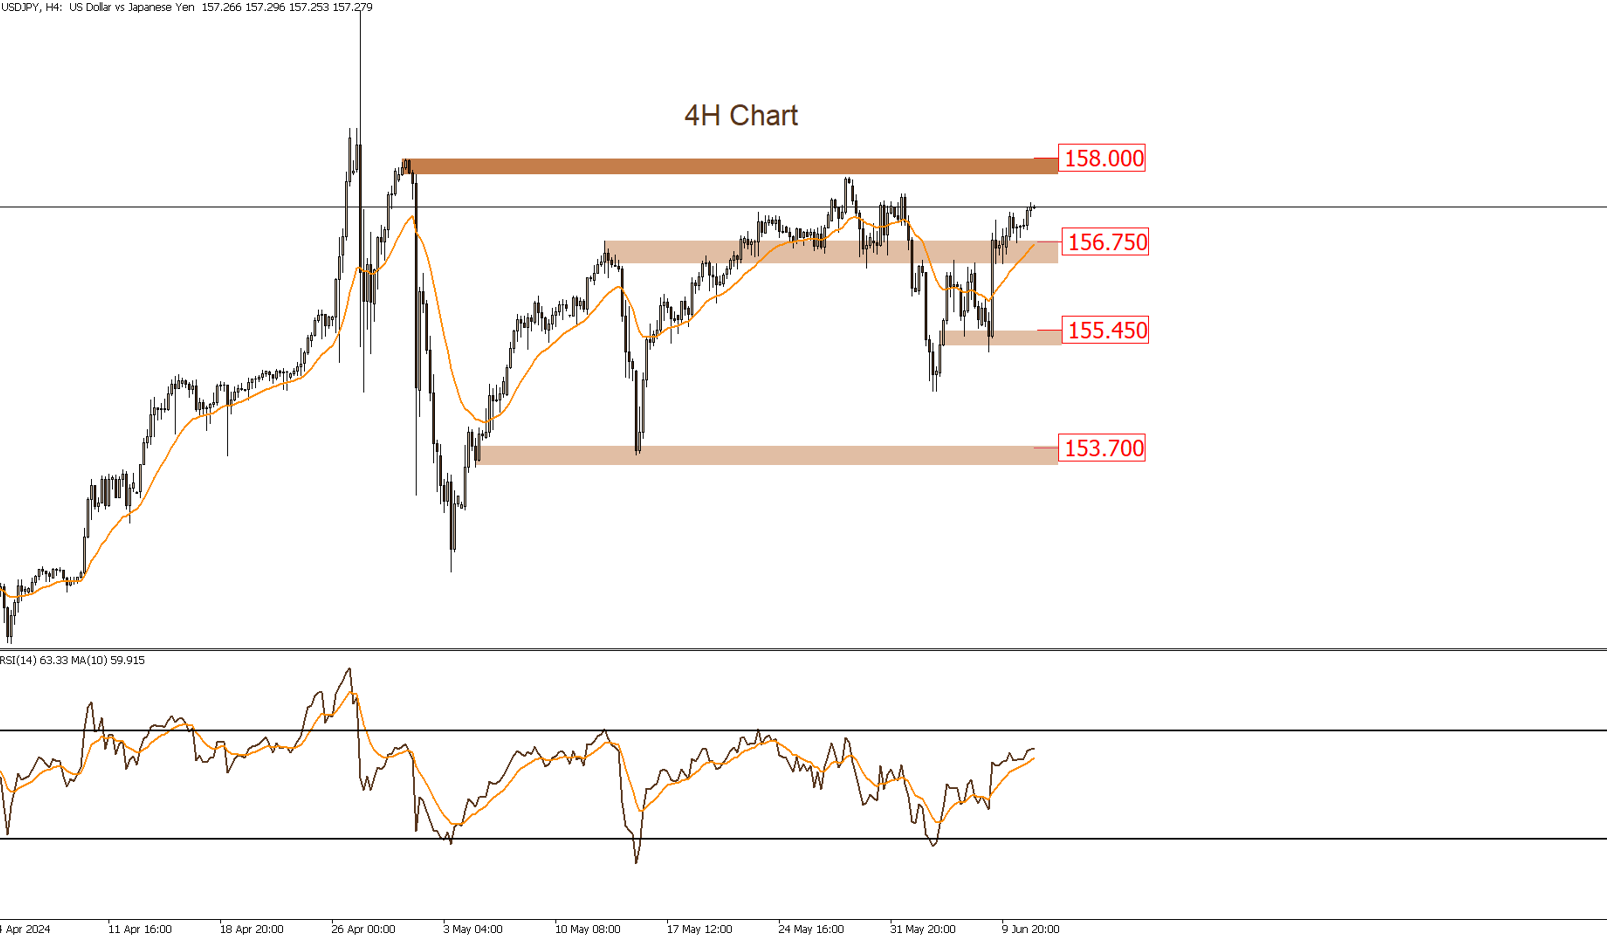
The USD/JPY pair has broken through the resistance area around 156.50, and it is likely to target the 158.00 level. This scenario becomes invalid if the 156.55 area is broken to the downside again.
|
Support |
156.75 | 156.50 | 156 |
| Resistance | 157.45 | 158 |
– |
GOLD
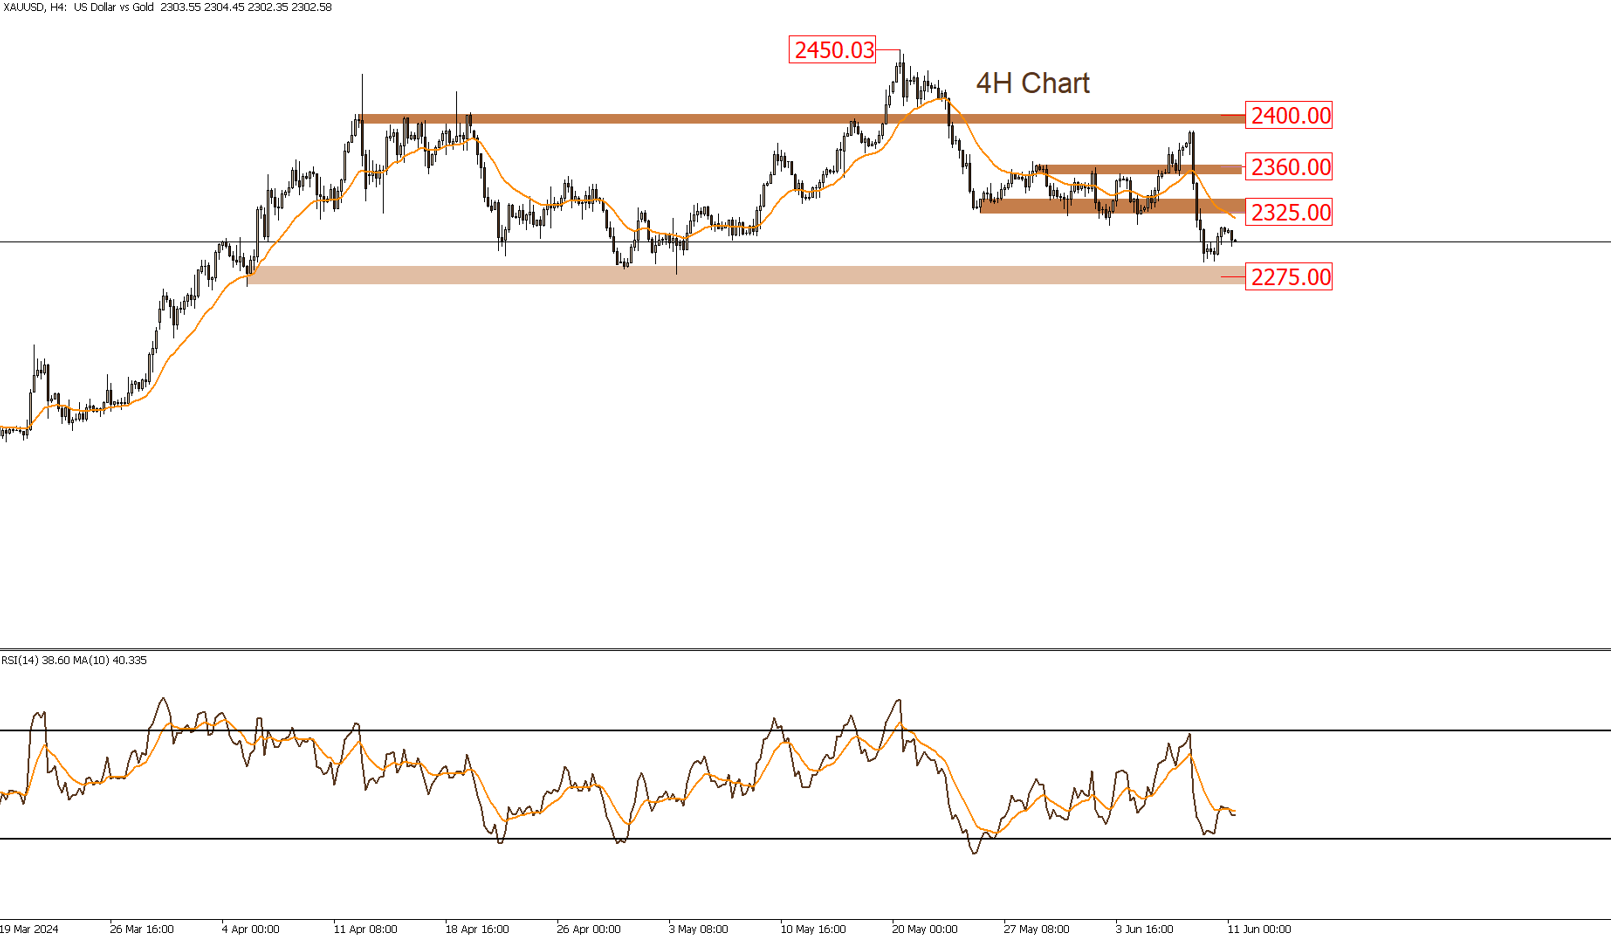
Gold is trading in a narrow sideways range between the resistance area of $2325 and the important support area of $2275, which, if broken to the downside, could see an acceleration in price decline.
|
Support |
2285 | 2265 | 2250 |
| Resistance | 2315 | 2325 |
2335 |
USOIL
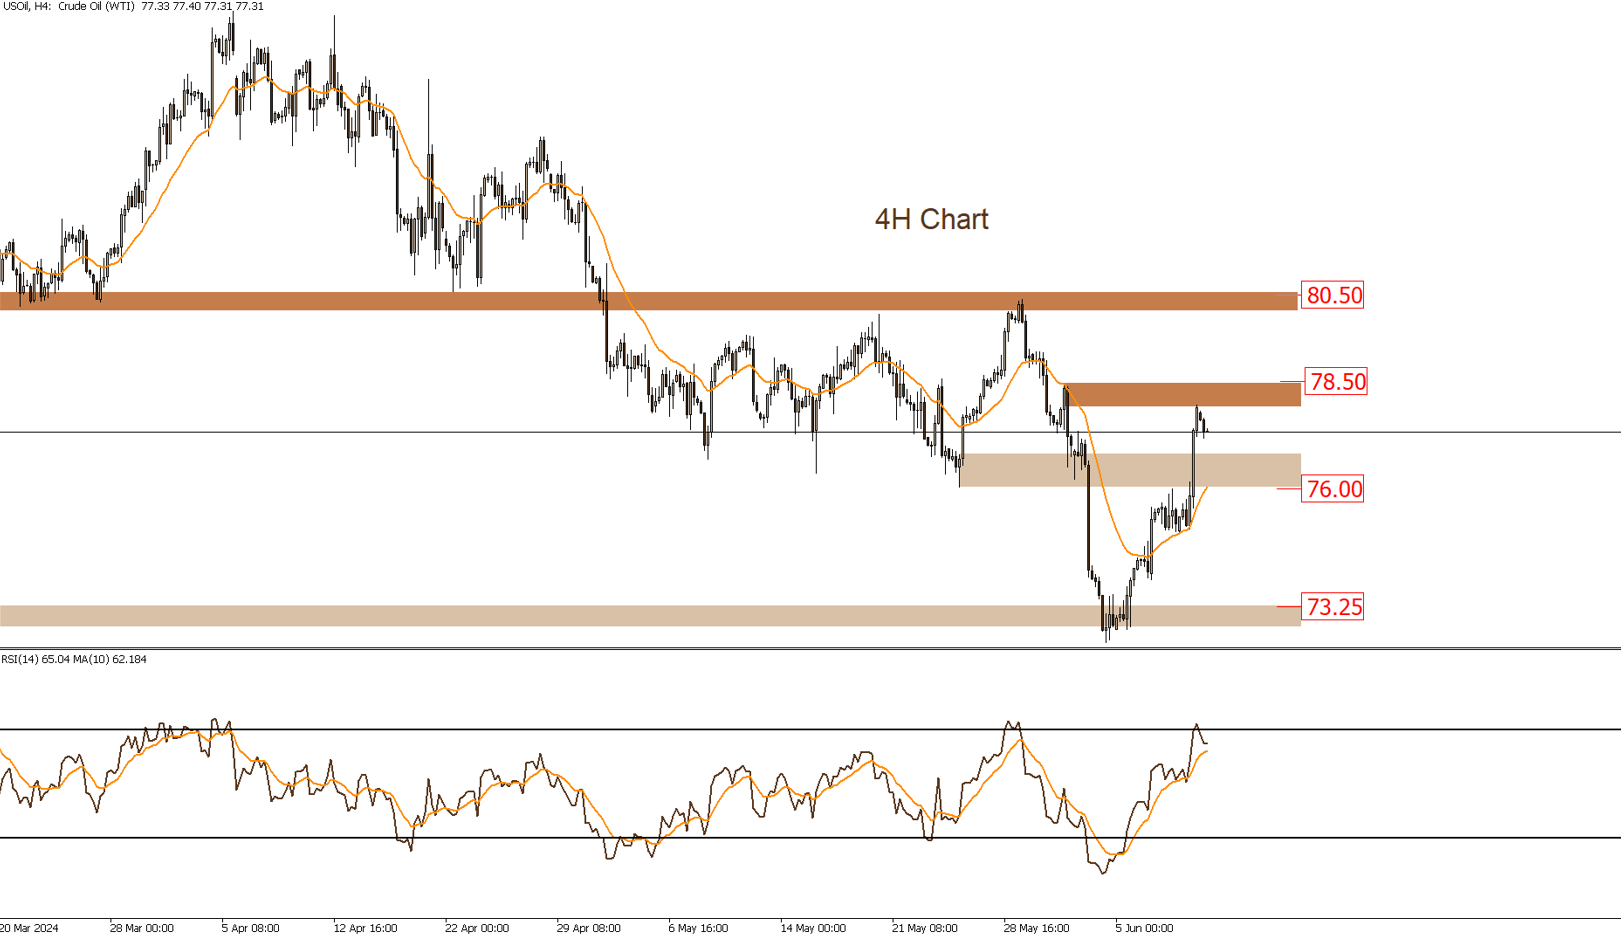
Oil has broken above the $76 level, and it is likely that prices will move within a sideways range between the resistance zone at $78.50 and the support zone at $76 in the upcoming trading sessions.
|
Support |
76.70 | 76 | 75 |
| Resistance | 78 | 78.50 |
79.20 |
BTCUSD
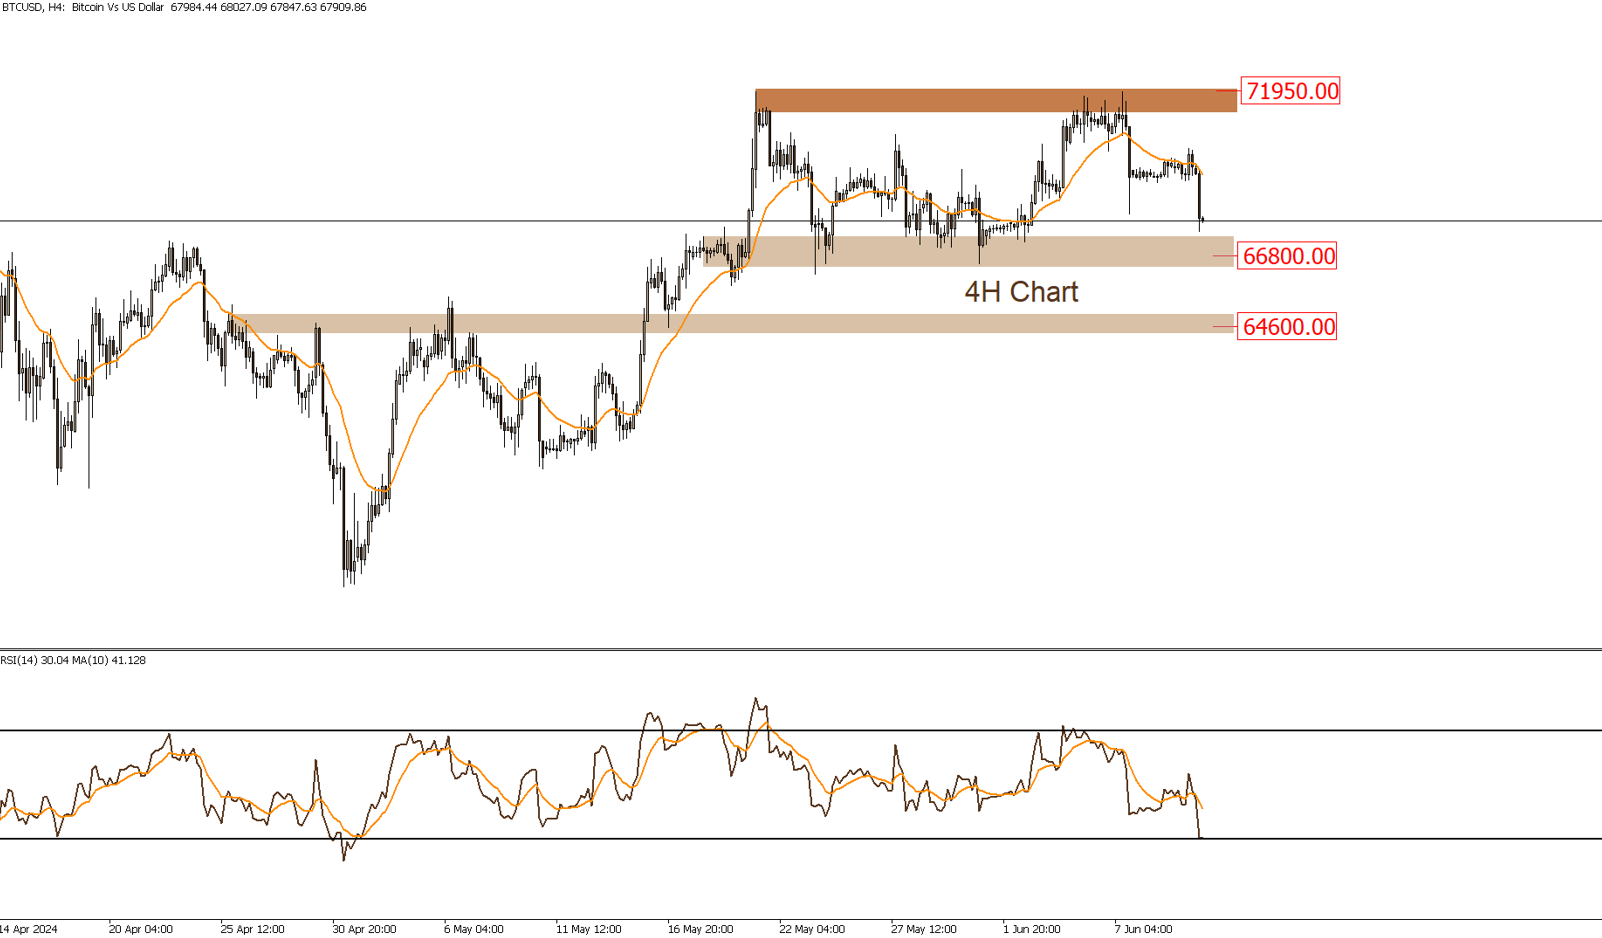
Bitcoin is trading within a sideways range between the resistance zone at $71,950 and the support zone at $66,800. If the support at $66,800 is broken to the downside, the target may be $64,600.
|
Support |
67750 | 66500 | 65000 |
| Resistance | 69200 | 70000 |
71500 |
DOWJONES
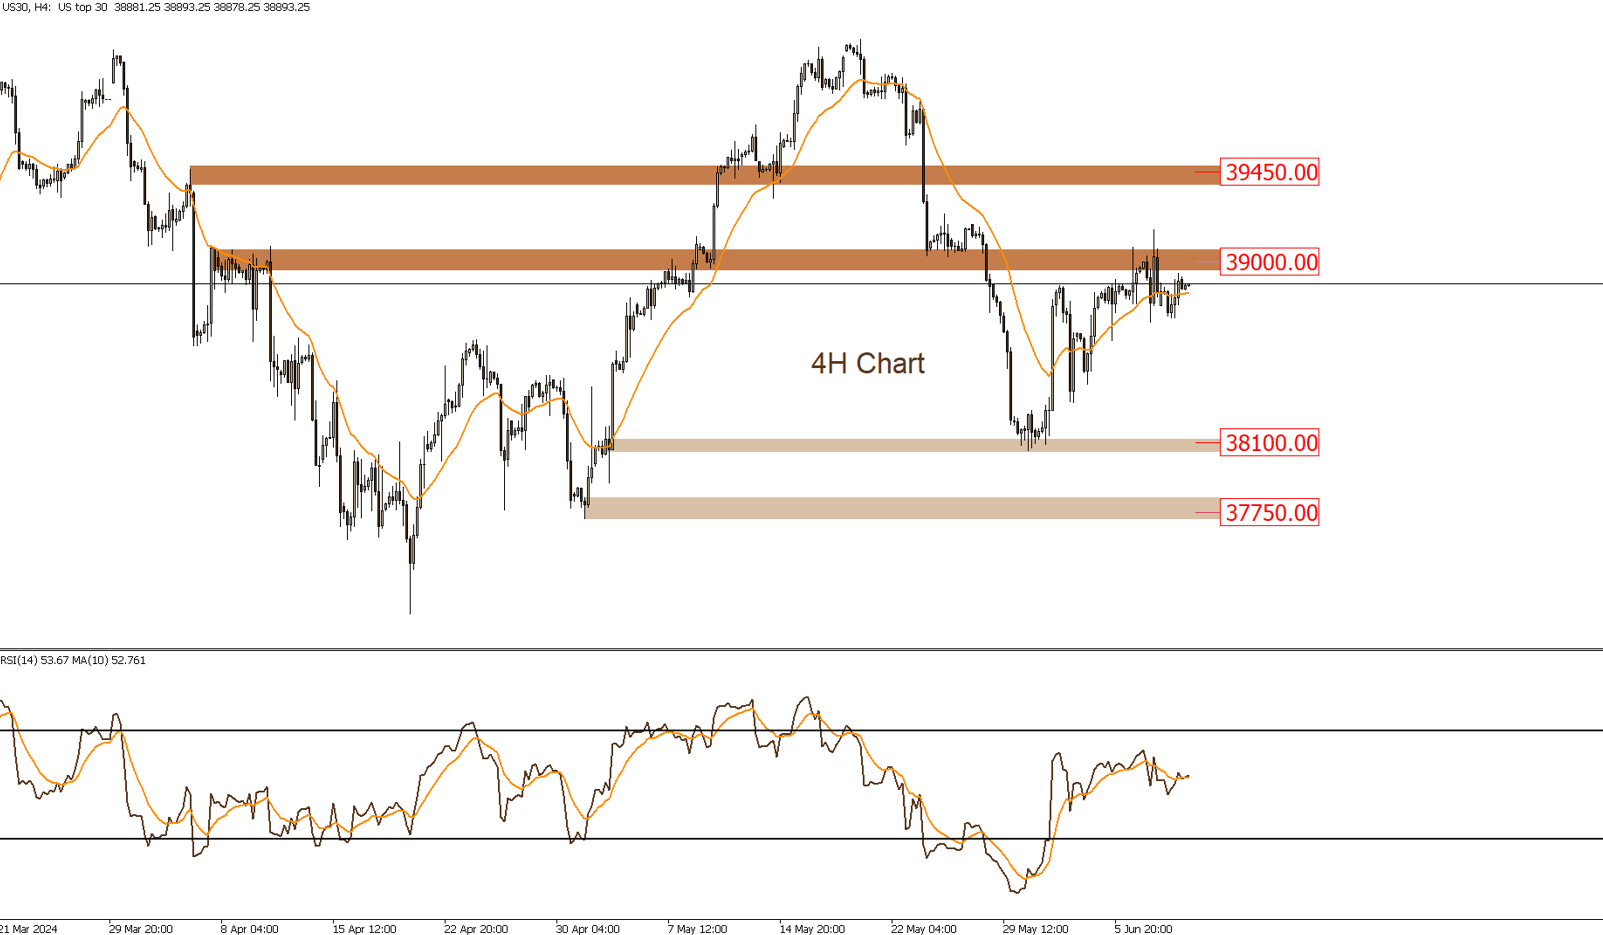
The Dow Jones Index is trading below the resistance zone at $39,000. It is likely that prices will continue to move sideways and test the support zone at $38,150. This scenario will be invalidated if the aforementioned resistance zone is broken to the upside.
|
Support |
38600 | 38450 | 38200 |
| Resistance | 39050 | 39200 |
39450 |
NASDAQ
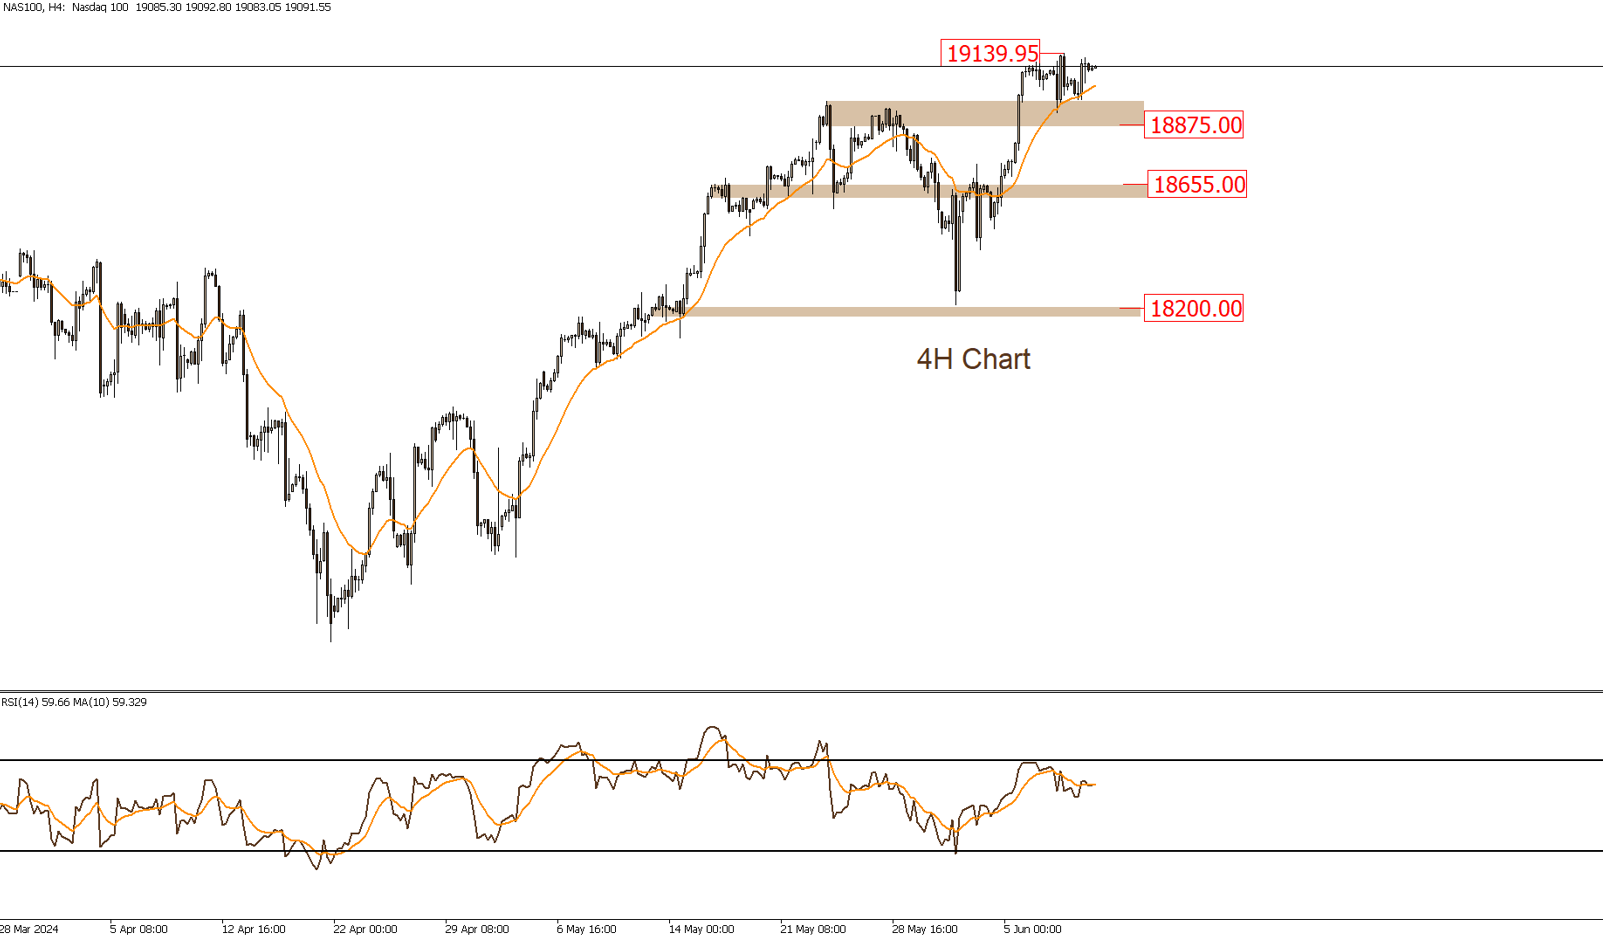
The Nasdaq Index has broken above its main peak, confirming the dominance of buying power and opening the way for targeting new highs. However, it is noticeable that momentum indicators have lost strength in recent trading sessions. Therefore, if prices are unable to remain above the $18,875 level, it is likely that we will retest the support zone at $18,655.
|
Support |
18970 | 18875 | 18705 |
| Resistance | 19140 | 19230 |
19280 |


