


DOLLAR INDEX
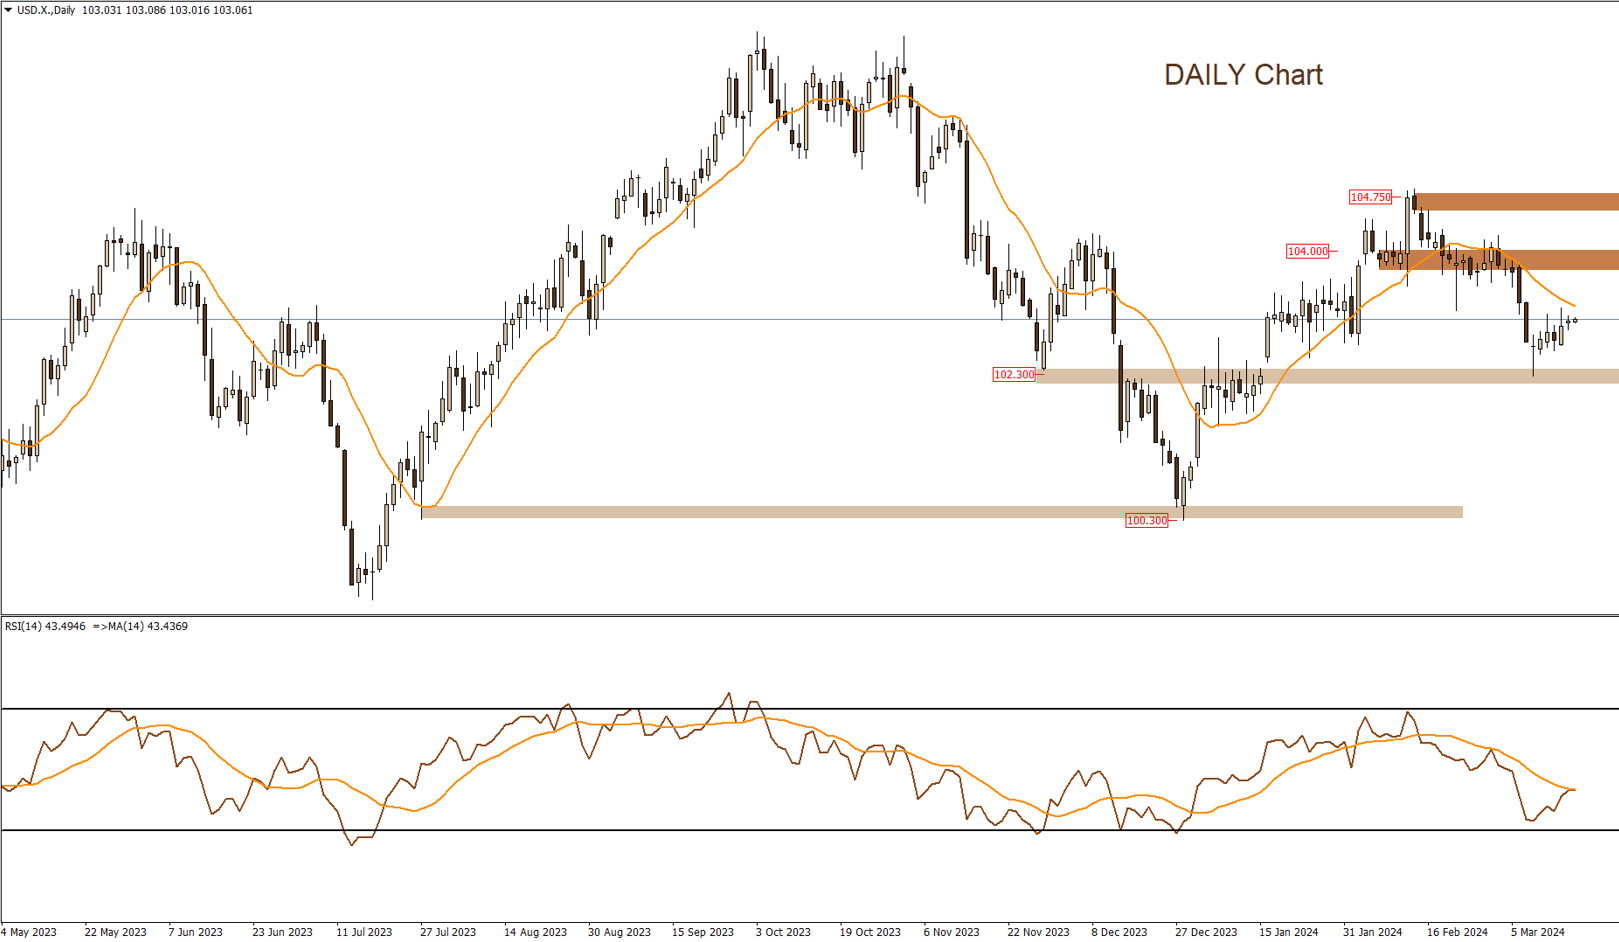
Prices rebounded from the support zone at 102.30, where it was likely to limit the downward momentum. With this, we may target the area around 104.
|
Support |
102.40 | 102.20 | 101.70 |
| Resistance | 103.15 | 103.75 |
104 |
EURUSD
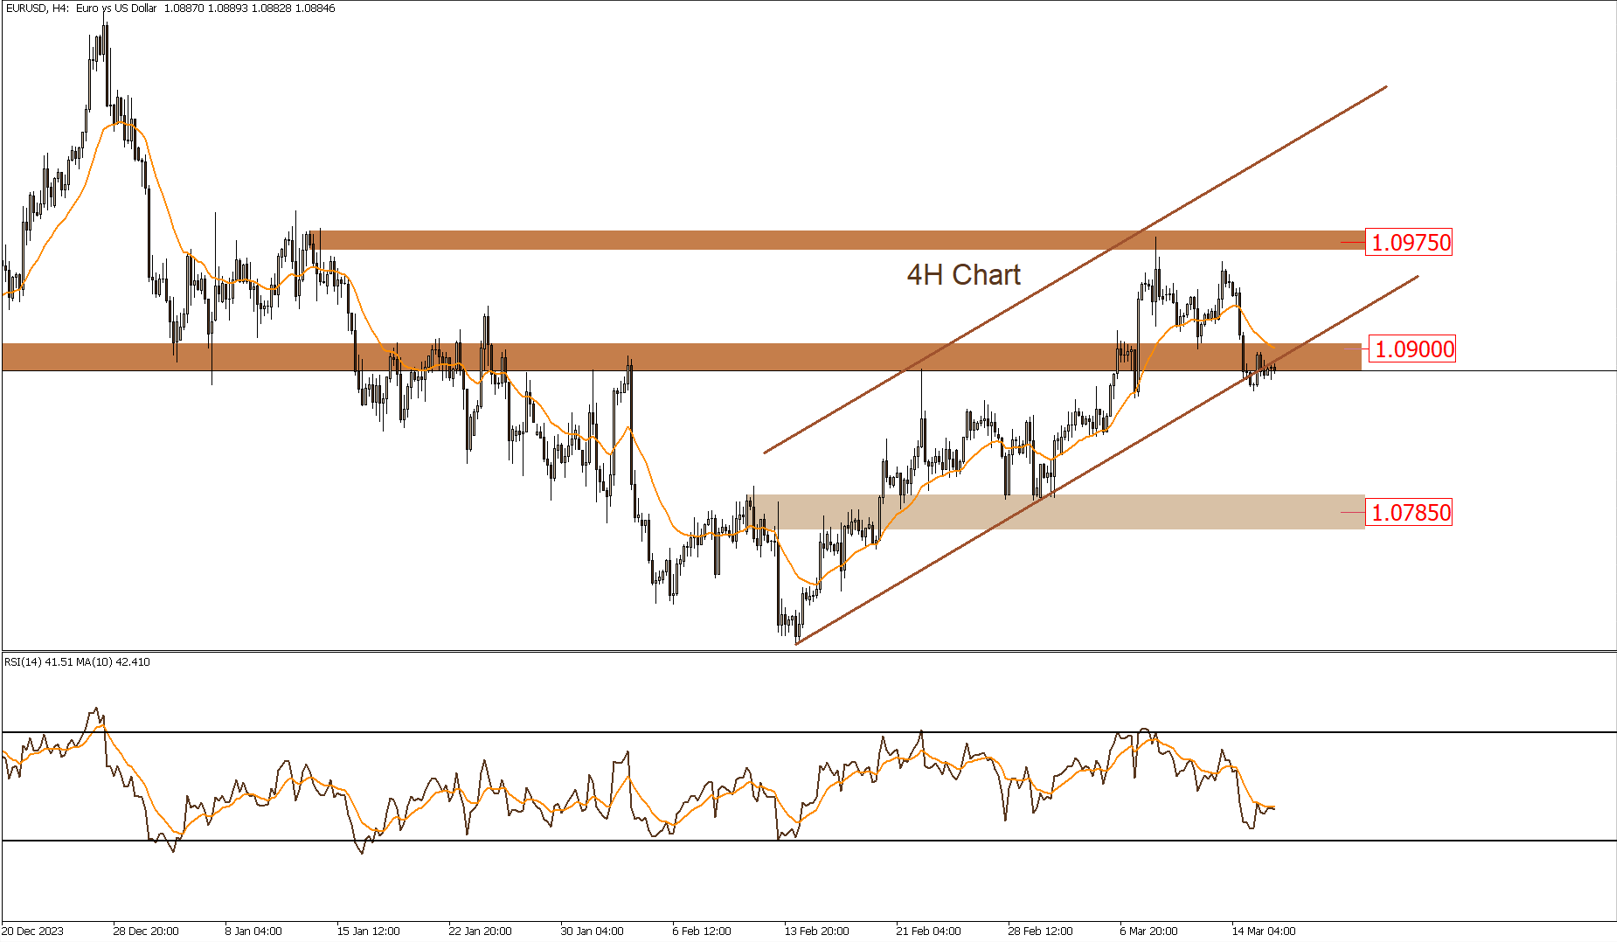
The selling pressure persisted, leading to a decline in prices until they reached support levels in the range of $1.0900. If the lower boundary of the upward channel is breached, prices are expected to target the $1.0785 area. This scenario would be invalidated if prices re-entered the $1.0900 level to the upside again.
|
Support |
1.0865 | 1.0840 | 1.0800 |
| Resistance | 1.0900 | 1.0950 |
1.0980 |
GBPUSD
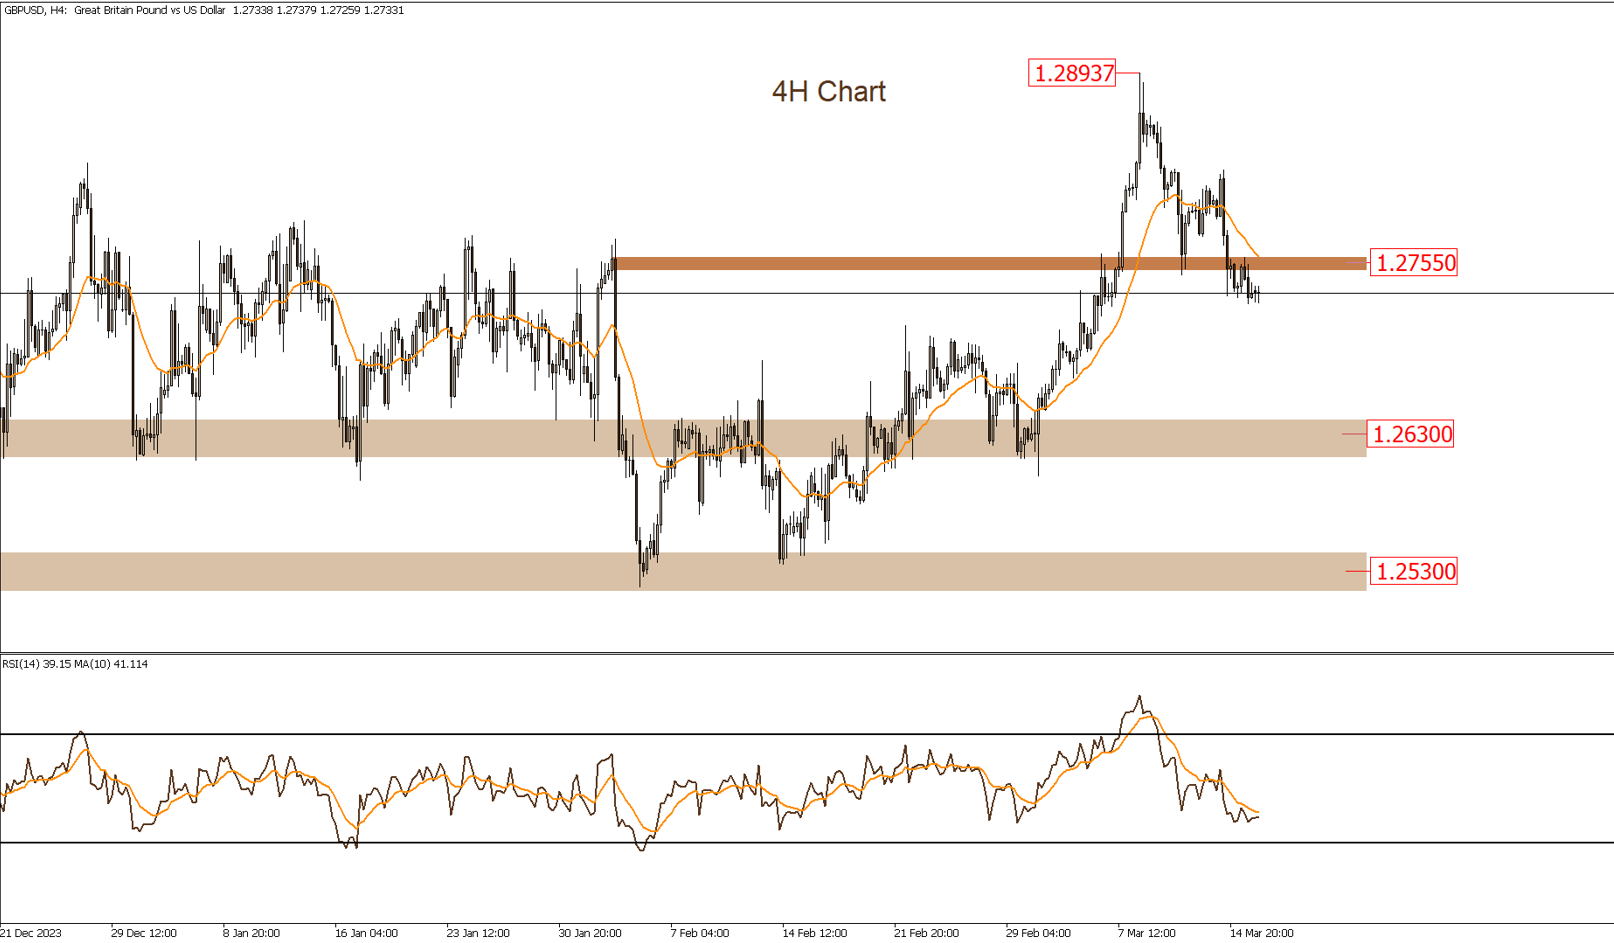
Prices are trading below resistance areas in the $1.2755 range, and in this scenario, we may target the $1.2630 areas. This scenario would be invalidated with a re-entry above the $1.2755 area.
|
Support |
1.2700 | 1.2670 | 1.2630 |
| Resistance | 1.2770 | 1.2770 |
1.2895 |
USDJPY
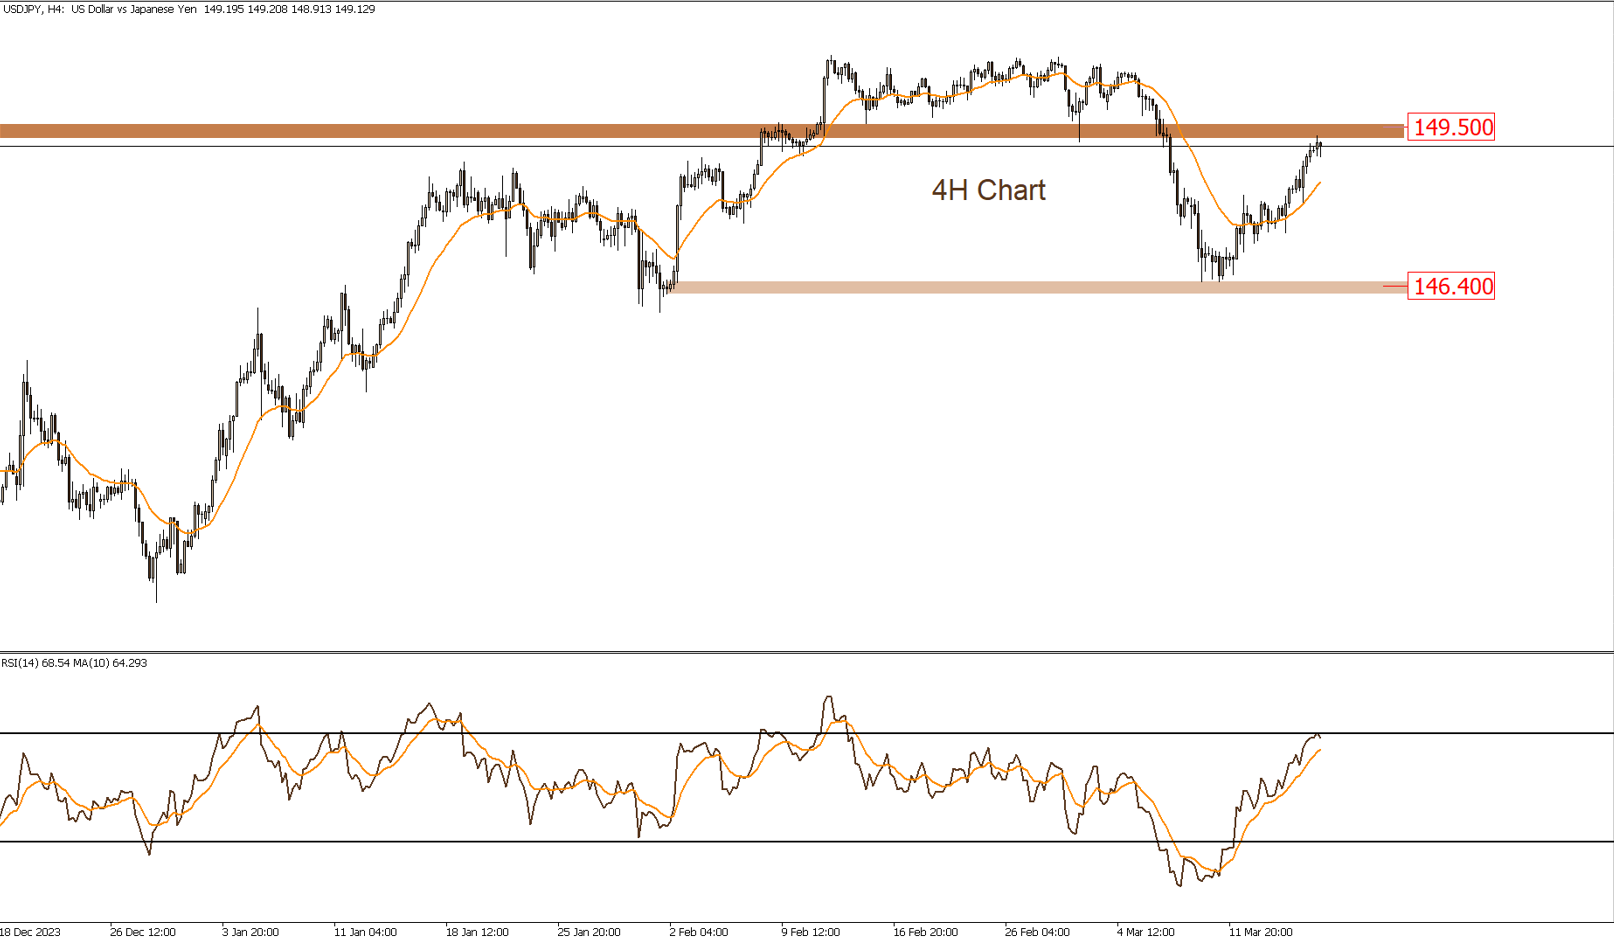
Prices are approaching the target of 149.50, where it is expected to encounter selling pressure in this area, which would limit the pace of the upward corrective movement.
|
Support |
148.7 | 148 | 147.40 |
| Resistance | 149.25 | 149.55 |
– |
GOLD
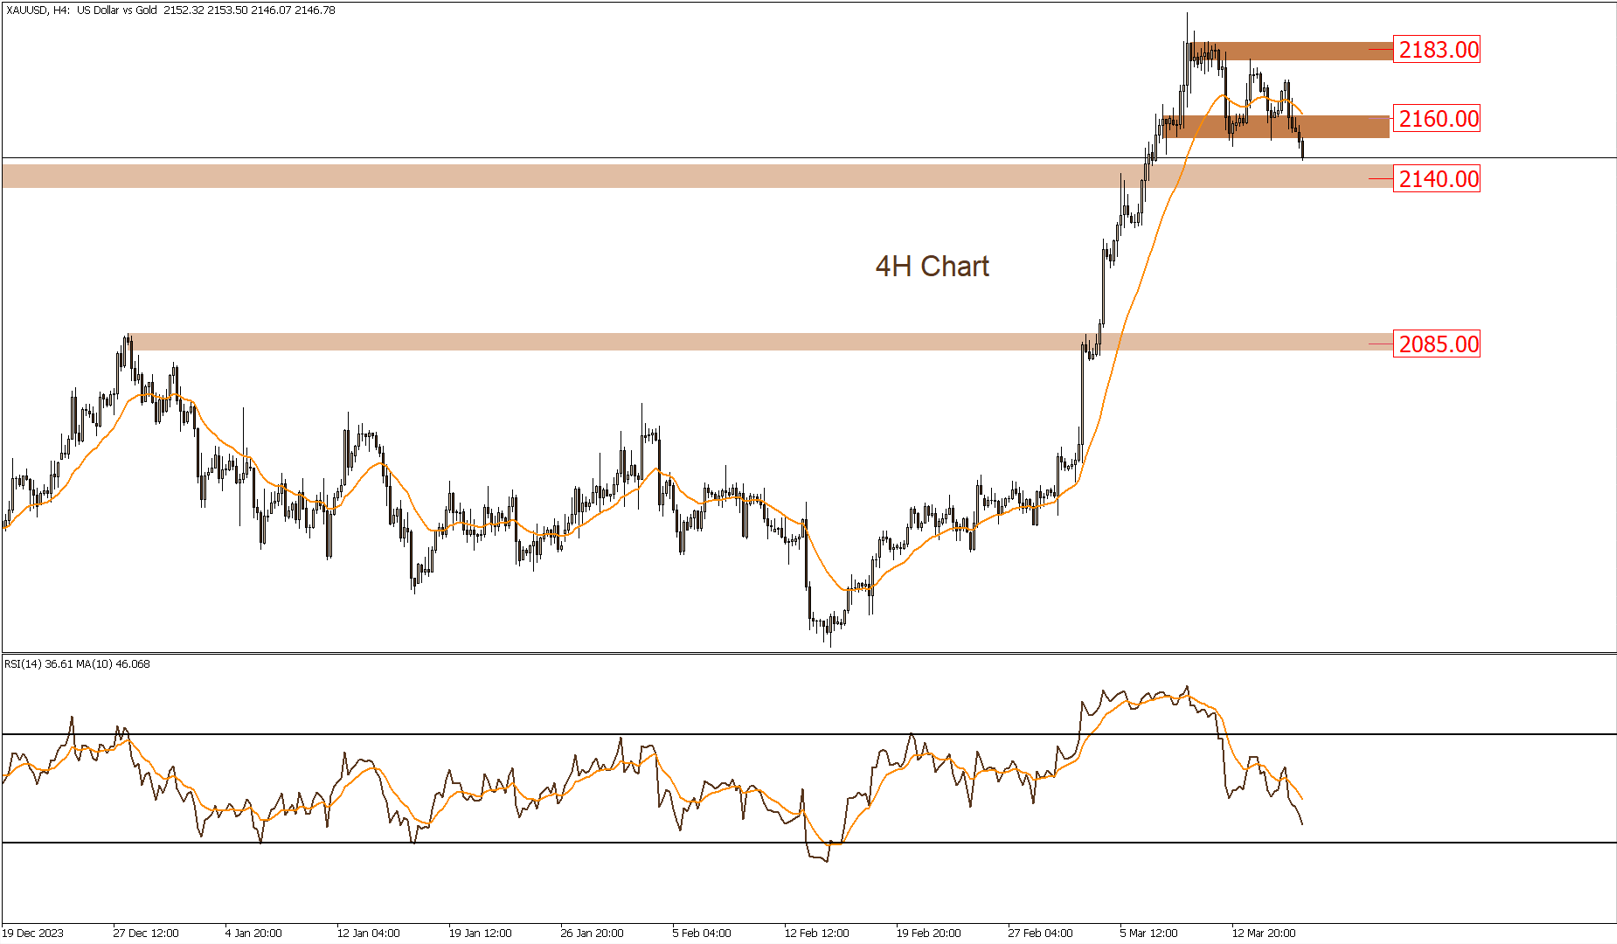
The price of gold is moving upwards on the medium-term, but it encountered selling pressure around the $2195 level, resulting in a decline in prices. Currently, prices are trading around the support zone of $2140. If this zone is breached to the downside, we may test the support at $2125.
|
Support |
2140 | 2125 | 2100 |
| Resistance | 2160 | 2183 |
2200 |
USOIL
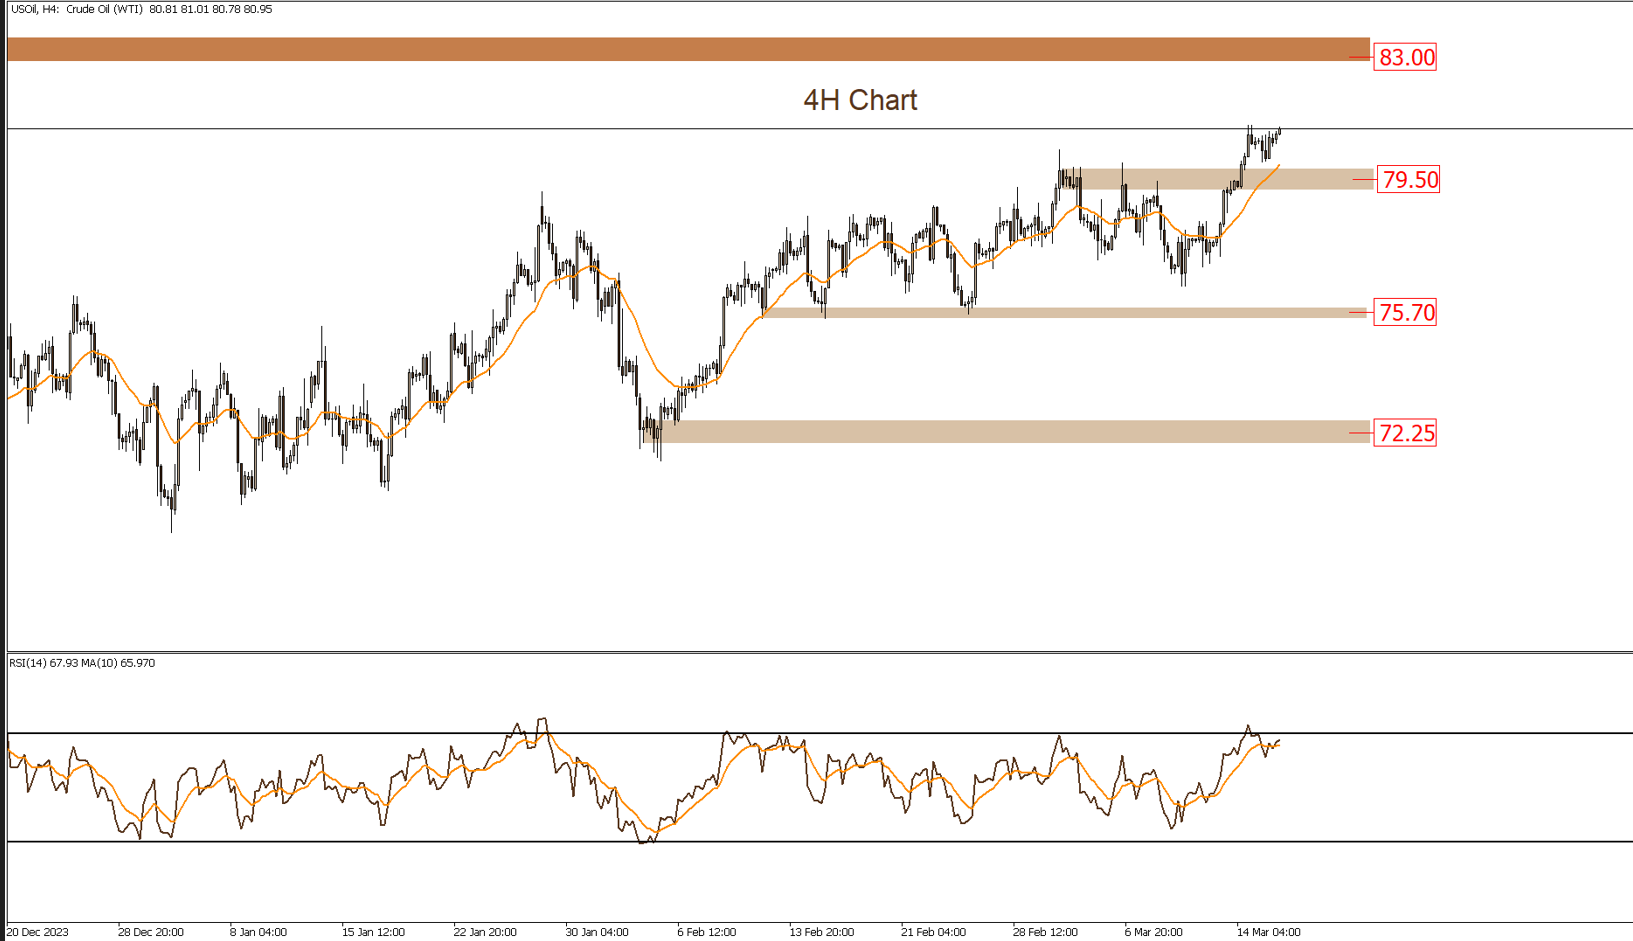
Prices have broken through secondary resistance levels in the $80 range to the upside, with an expected target of $83. This scenario would be invalidated if the price re-breaks below $79.5.
|
Support |
79.5 | 77.5 | 75.7 |
| Resistance | 81 | 83 |
83.5 |
BTCUSD
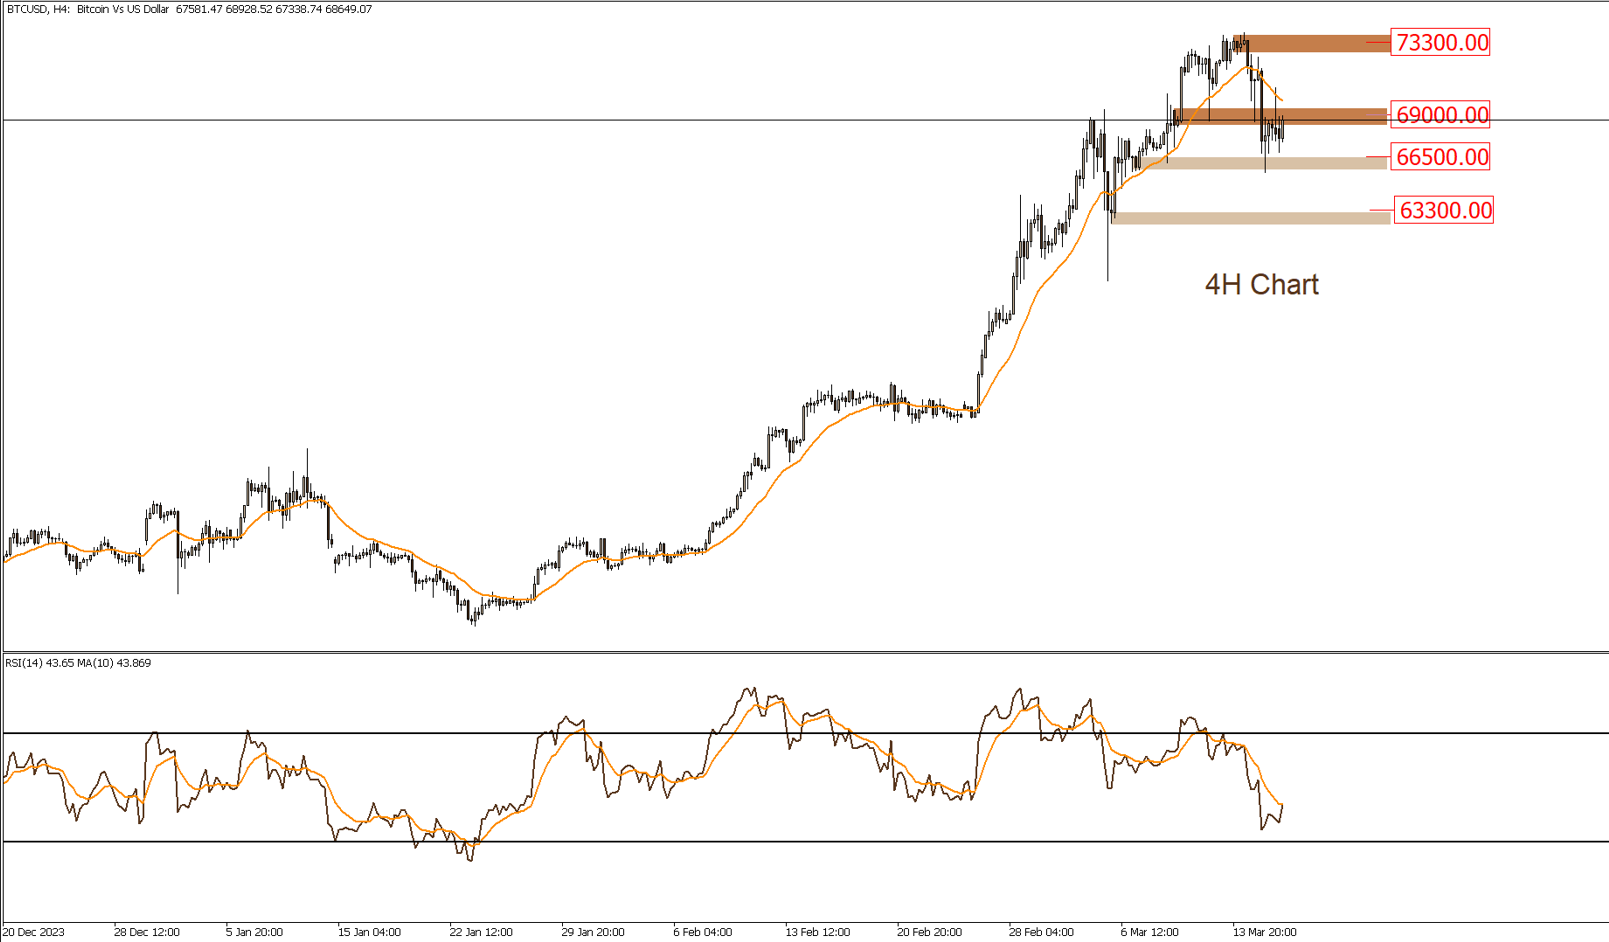
Bitcoin is moving upwards on the medium-term timeframe, but it faced strong selling pressure around $73,300, leading to a decline in prices. Currently, prices are trading near the support zone at $66,500. It is not expected that prices will be able to break above the key resistance at $73,300 in the short term.
|
Support |
66500 | 63300 | 61000 |
| Resistance | 69000 | 71500 |
73500 |
DOWJONES
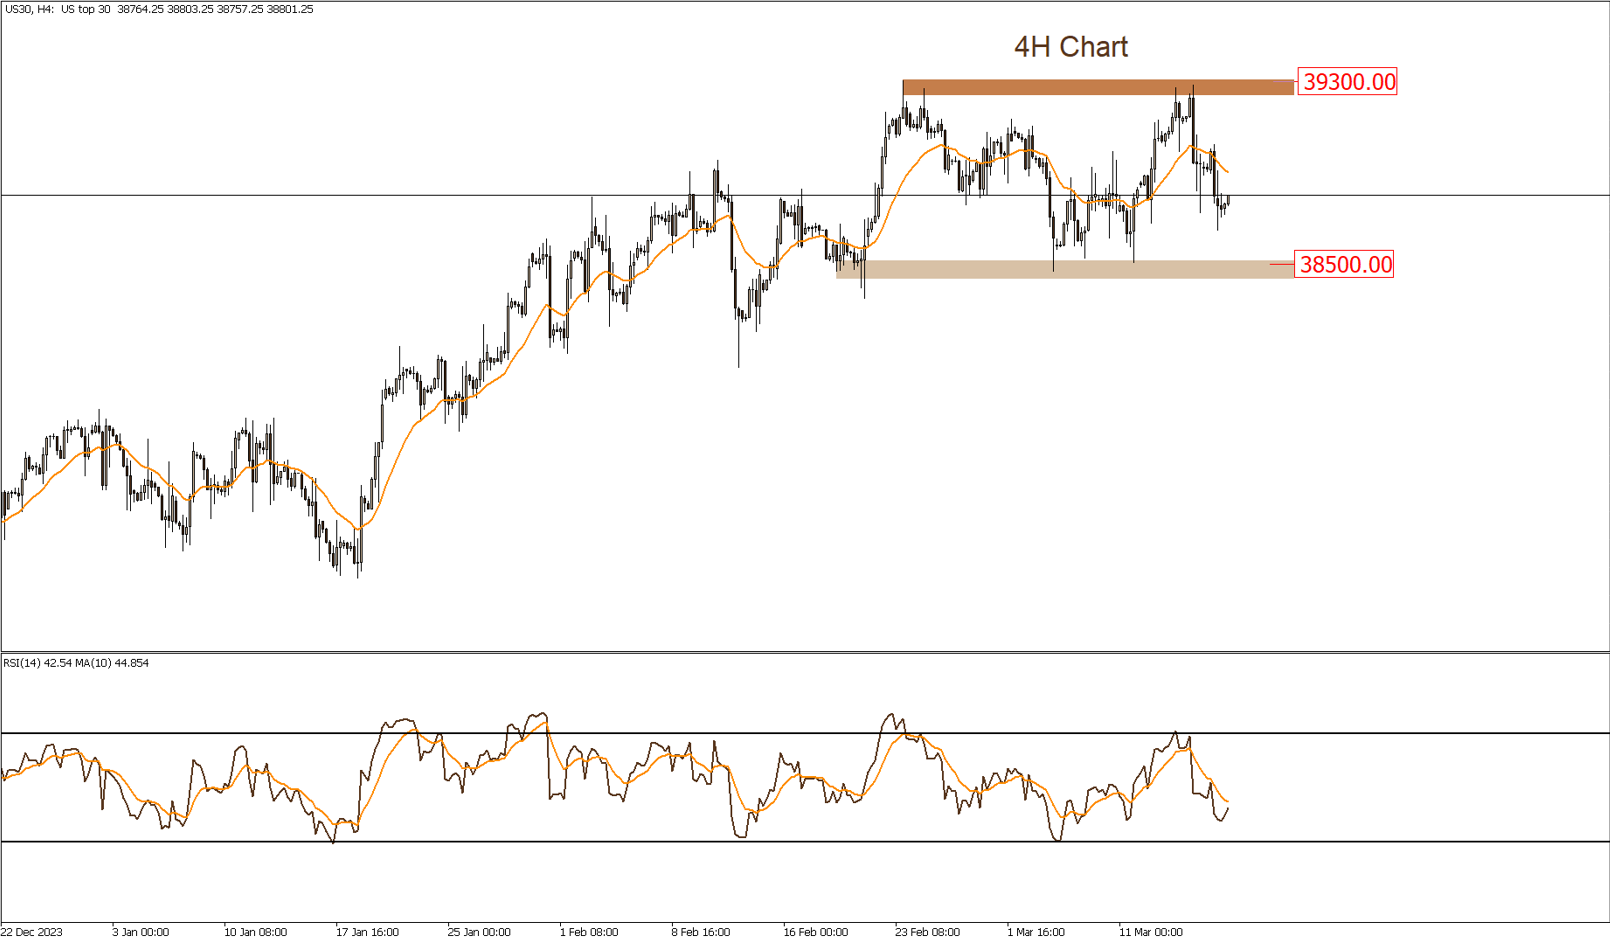
The Dow Jones index is trading sideways in the short term, between the support at $38,500 and the previous resistance zone at $39,300. In the event of prices breaking above these levels, a further upward movement is likely, resuming the medium-term uptrend. However, this scenario would be invalidated if the key support level at $38,000 is broken to the downside.
|
Support |
38750 | 38500 | 38200 |
| Resistance | 39000 | 39150 |
39300 |
NASDAQ
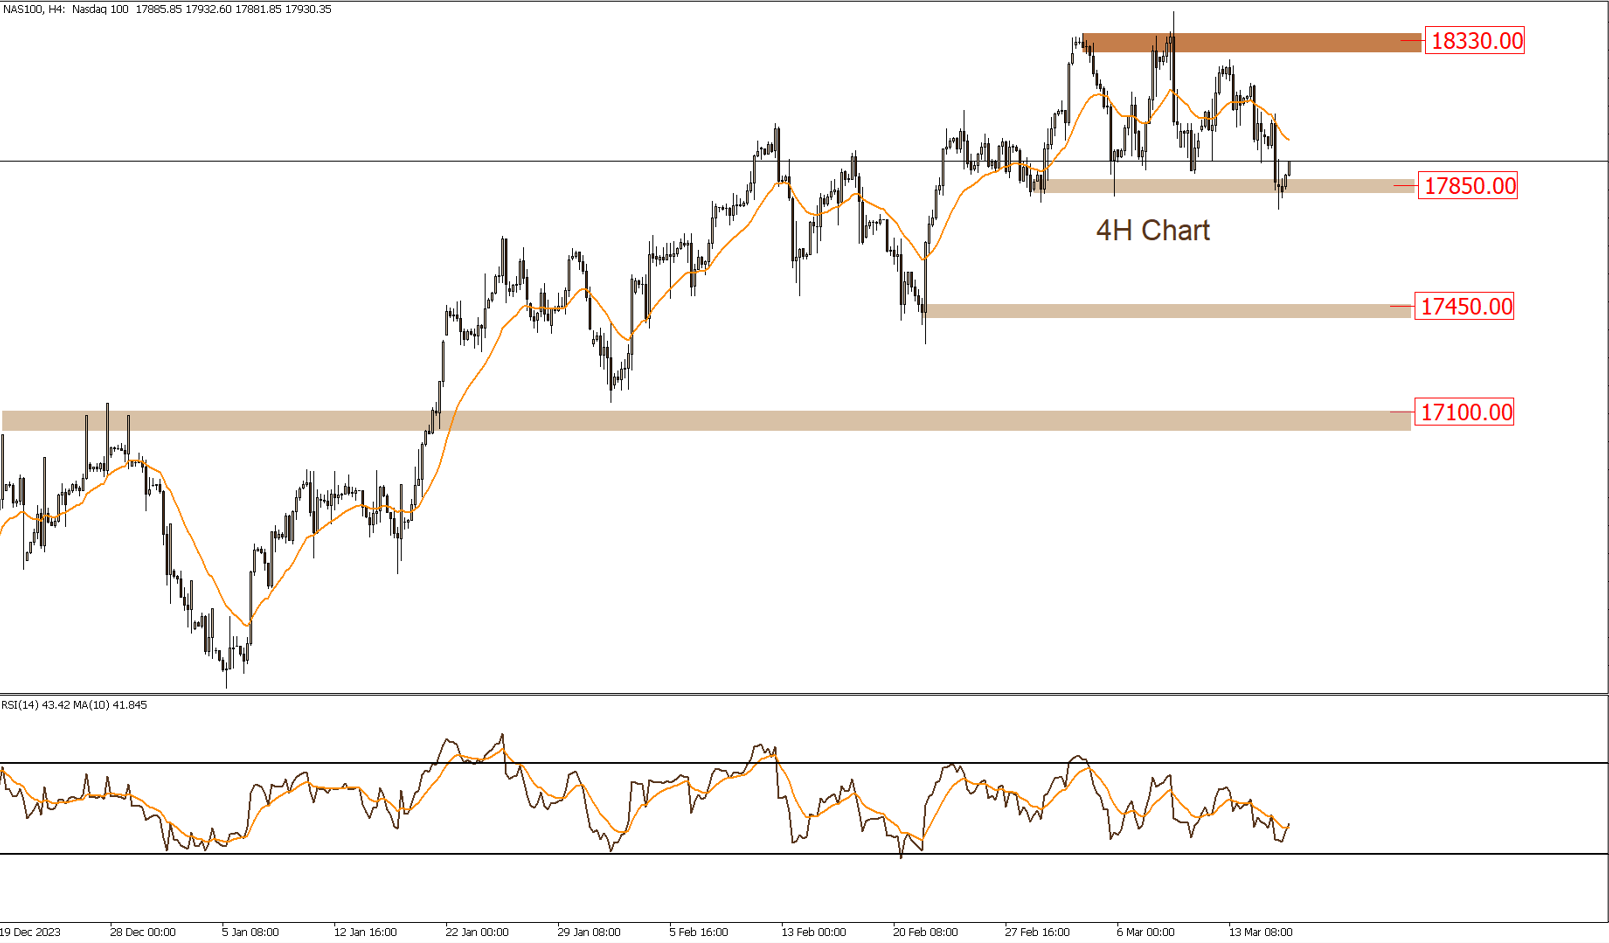
The Nasdaq index is trading sideways in the short term. If prices remain above the $17850 level, it’s likely to target the zone around $18330. However, this scenario would be invalidated if prices break below the $17850 level.
|
Support |
17650 | 17450 | 17320 |
| Resistance | 17850 | 18100 |
18350 |


