Overview :
Developed by J. Welles Wilder and introduced in his book, New Concepts in Technical Trading Systems (1978), the Average True Range (ATR) indicator measures a security’s volatility. As such, the indicator does not provide an indication of price direction or duration, simply the degree of price movement or volatility.
As with most of his indicators, Wilder designed ATR with commodities and daily prices in mind. In 1978, commodities were frequently more volatile than stocks. However, recent Nasdaq price action may belie that notion. In addition, commodities were (and still are) often subject to gaps and limit moves. A limit move occurs when a commodity opens up or down its maximum allowed move and does not trade again until the next session. The resulting bar or candlestick would simply be a small dash. In order to accurately reflect the volatility associated with commodities, Wilder sought to account for gaps, limit moves and small high/low ranges in his calculations. A volatility formula based on only the high/low range would fail to capture the actual volatility created by the gap or limit move.
Wilder defined the true range (TR) as the greatest of the following :
1- The current high less the current low.
2- The absolute value of: current high less the previous close.
3- The absolute value of: current low less the previous close.
If the current high/low range is large, chances are it will be used as the TR. If the current high/low range is small, it is likely that one of the other two methods would be used to calculate the TR. The last two possibilities usually arise when the previous close is greater than the current high (signaling a potential gap down and/or limit move) or the previous close is lower than the current low (signaling a potential gap up and/or limit move). To ensure positive numbers, absolute values were applied to differences.
Interpretation :
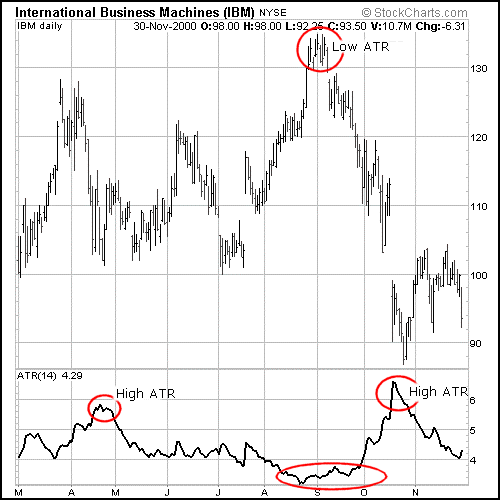
Wilder has found that high ATR values often occur at market bottoms following a “panic” sell-off. Low Average True Range values are often found during extended sideways periods, such as those found at tops and after consolidation periods.
The Average True Range can be interpreted using the same techniques that are used with the other volatility indicators. Refer to the discussion on Standard Deviation for additional information on volatility interpretation.
Example :
The following chart shows McDonald’s and its Average True Range.
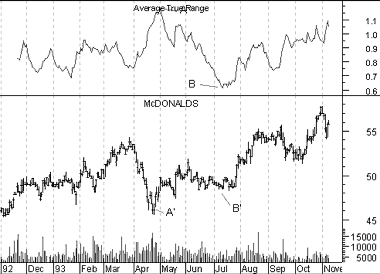
This is a good example of high volatility as prices bottom (points “A” and “A'”) and low volatility as prices consolidate prior to a breakout (points “B” and “B'”).
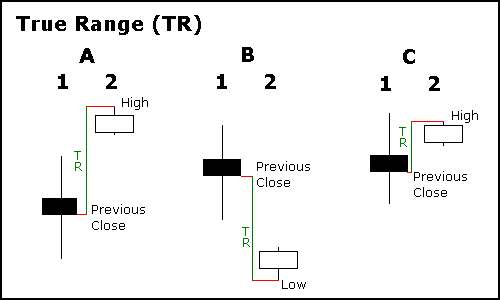
The example above shows three potential situations when the TR would not be based on the current high/low range. Notice that all three examples have small high/low ranges and two examples show a significant gap.
1- A small high/low range formed after a gap up. The TR was found by calculating the absolute value of the difference between the current high and the previous close.
2- A small high/low range formed after a gap down. The TR was found by calculating the absolute value of the difference between the current low and the previous close.
3- Even though the current close is within the previous high/low range, the current high/low range is quite small. In fact, it is smaller than the absolute value of the difference between the current high and the previous close, which is used to value the TR.
Typically, the Average True Range (ATR) is based on 14 periods and can be calculated on an intraday, daily, weekly or monthly basis. For this example, the ATR will be based on daily data. Because there must be a beginning, the first TR value in a series is simply the high minus the
low and the first 14-day ATR is found by averaging the daily ATR values for the last 14 days. After that, Wilder sought to smooth the data set, by incorporating the previous period’s ATR value. The second and subsequent 14-day ATR value would be calculated with the following steps:
1- Multiply the previous 14-day ATR by 13.
2- Add the most recent day’s TR value.
3- Divide by 14.
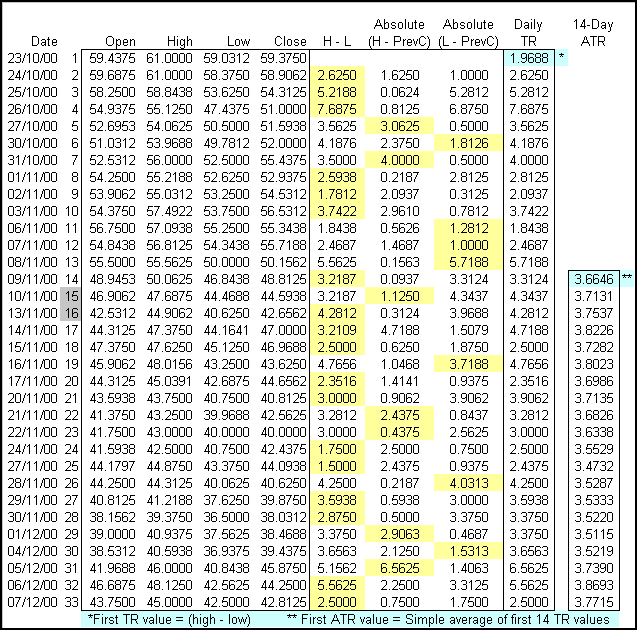
In the Excel spread sheet example above, the first TR value (1.9688) equals the high minus the low. The first 14-day ATR value (3.6646) was calculated by finding the average of first 14 TR values. The second ATR value started the smoothing process by using the previous value.
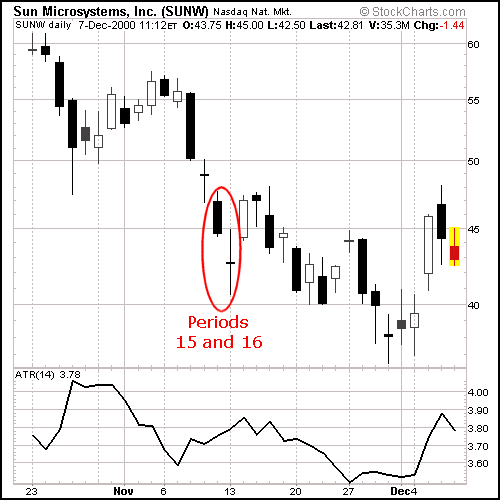
The chart above corresponds with the Excel spreadsheet calculations for Sun Microsystems from 23-Oct 2000 to 7-Dec 2000.
1- Day 15 : (( 3.6646 x 13 ) + 4.3437 ) / 14 = 3.7131
2- Day 16 : (( 3.7131 x 13 ) + 4.2812 ) / 14 = 3.7536
For those trying this at home, here are a few cautionary notes on calculations.
1- There is always a beginning and the first calculations may not conform exactly with the formula. The first TR value is simply the high minus the low and the first ATR is a simple average of the first 14 TR values.
2- Second, many indicators involve a smoothing process. In this example, the previous period’s ATR is used to form the current ATR.
3- This example only contains a small portion of total available price data. The size of the data set will affect the final outcome. Although the difference is not likely to be huge, a data set of 33 days will produce a different ATR value than a data set of 500 days.
4- If you wish to replicate this formula, first try and duplicate the example provided using the same open/high/low/close data. Once your formulas produce answers that match the example, you can then plug in your desired open/high/low/close data.
5- Due to rounding issues and decimal places, an exact match may not be possible. Also, discrepancies in the open/high/low/close data can produce different indicator values.