Overview :
The Accumulation Swing Index is a cumulative total of the Swing Index. The Accumulation Swing Index was developed by Welles Wilder.
Interpretation :
Mr. Wilder said, “Somewhere amidst the maze of Open, High, Low and Close prices is a phantom line that is the real market.” The Accumulation Swing Index attempts to show this phantom line. Since the Accumulation Swing Index attempts to show the “real market,” it closely resembles prices themselves. This allows you to use classic support/resistance analysis on the Index itself. Typical analysis involves looking for breakouts, new highs and lows, and divergences.
Wilder notes the following characteristics of the Accumulation Swing Index : 1- It provides a numerical value that quantifies price swings. 2- It defines short-term swing points. 3- It cuts through the maze of high, low, and close prices and indicates the real strength and direction of the market.
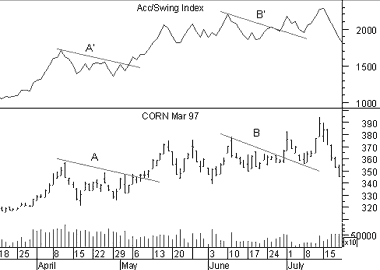
Example :
The following chart shows Corn and its Accumulation Swing Index. You can see that the breakouts of the price trendlines labeled “A” and “B” were confirmed by breakouts of the Accumulation Swing Index trendlines labeled “A'” and “B’.”
Calculation :
The Accumulation Swing Index is a cumulative total of the Swing Index. The Swing Index and the Accumulation Swing Index require opening prices.
You can now benefit from LDN company’s services through the LDN Global Markets trading platform.
I’m a Trader with 17 years of experience in the most of Financial Markets ( Equities, Commodities , Forex). I have worked on integrated campaigns for major clients such as Al Horria brokerage, Venus International and Admiral Markets.
Until recently, I Trade in Only the International Markets industry. In this role I was focused on Trading and Portfolio Managing .Successes included creating a social expert to mange the accounts of my clients automatically decisions.
Colleagues know me as a highly creative Trader who can always be trusted to come up with a new techniques . But I know that the client’s business comes first, and I never try to impose my ideas on others. Instead, I spend a lot of time understanding and collecting data about the several markets I can work well alone, but I’m at my best collaborating with others.
I have a PhD from AIN SHAMS University and a Cfte1 from the International Federation of Technical Analysts IFTA.


 You can see that the breakouts of the price trendlines labeled “A” and “B” were confirmed by breakouts of the Accumulation Swing Index trendlines labeled “A'” and “B’.”


