Rate of change measurements measure momentum, which is the rate at which price changes are taking place. Consider a golf drive, for example. A well-hit ball leaves the tee quickly, rising and gaining altitude quickly. Momentum is very high. Although it might be difficult to estimate the carry of the drive in its initial rise from the tee, it is often possible to determine, from the initial rate of rise of the ball, that this is a well-hit drive, likely to carry for some considerable distance. Sooner or later, the rate of climb of the ball clearly diminishes and the ball loses momentum. At this time, an estimate of the final distance of the drive can be more readily made. The important concept involved is that rates of rise diminish before declines actually get under way. The falling rate of change of the drive provides advance warning that the ball is soon going to fall to the ground.
Example :
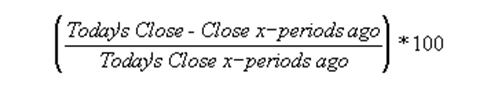
The following chart shows the 12-day ROC of Walgreen expressed in percent.
![]()
I drew “buy” arrows each time the ROC fell below, and then rose above, the oversold level of -6.5. I drew “sell” arrows each time the ROC rose above, and then fell below, the overbought level of +6.5.
The optimum overbought/oversold levels (e.g., ±6.5) vary depending on the security being analyzed and overall market conditions. I selected ±6.5 by drawing a horizontal line on the chart that isolated previous “extreme” levels of Walgreen’s 12-day ROC.
Calculation :
When the Rate-of-Change displays the price change in points, it subtracts the price x-time periods ago from today’s price:
![]()
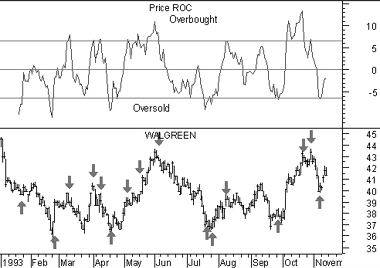
When the Rate-of-Change displays the price change as a percentage, it divides the price change by price x-time period’s ago: